
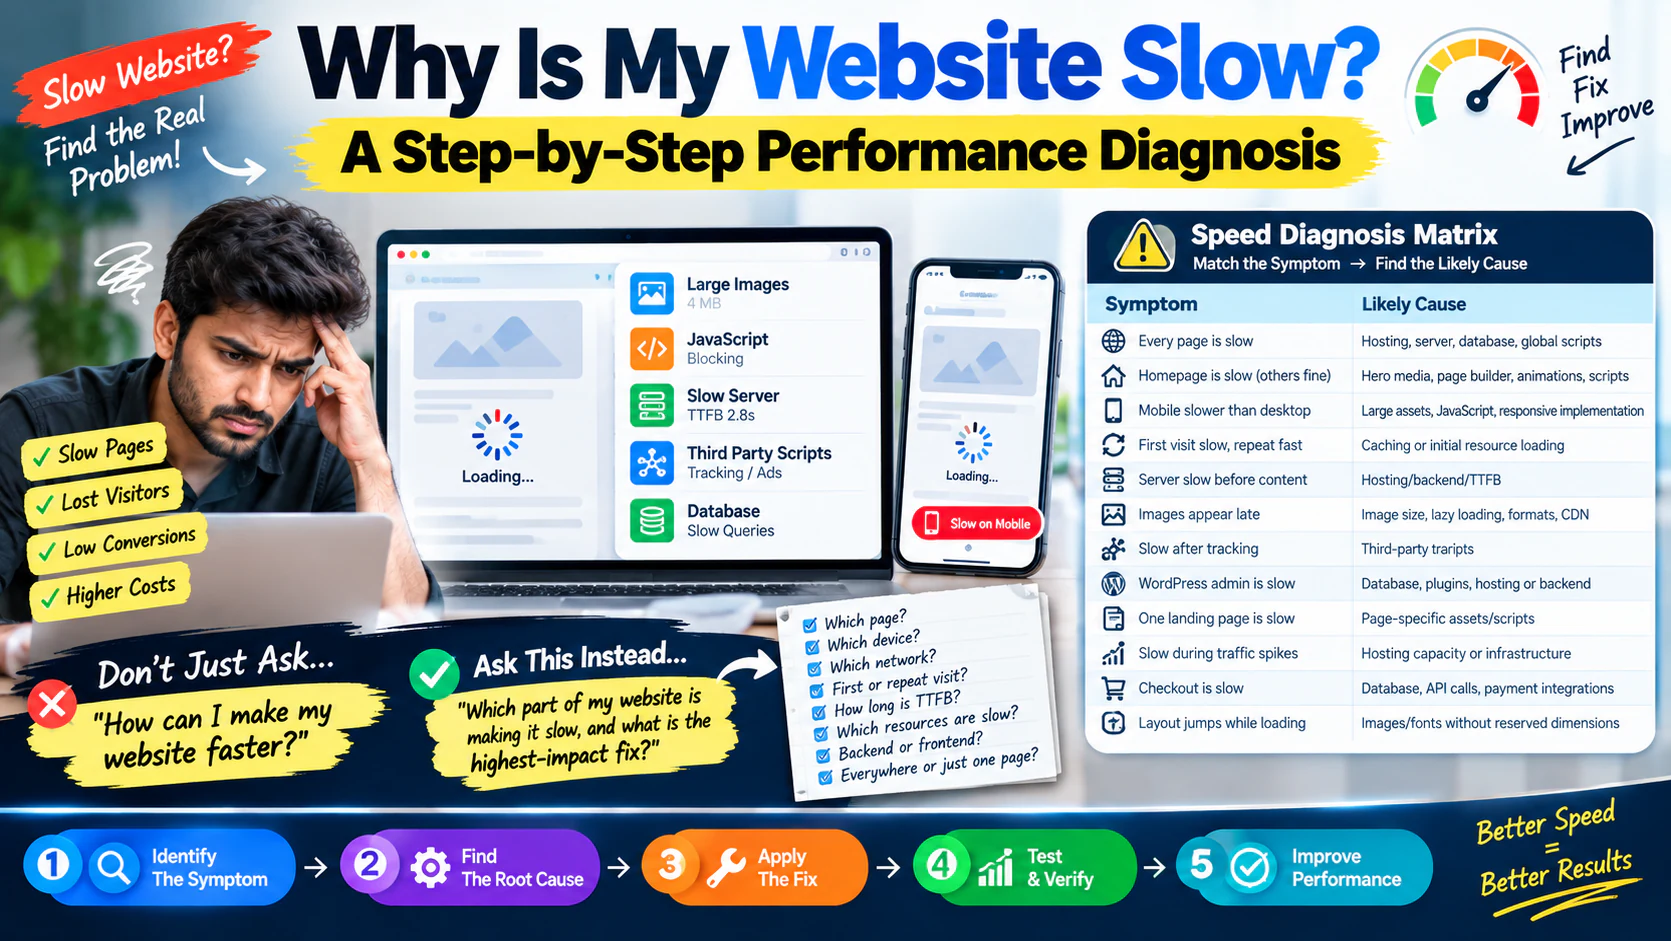
A slow website is rarely caused by one single problem.
Sometimes the server takes too long to respond. Sometimes a 4 MB hero image is being loaded on every visit. Sometimes a WordPress plugin is generating unnecessary requests. Sometimes third-party scripts are blocking the page. Sometimes the website is technically fast on desktop but painfully slow on mobile.
And sometimes the website owner keeps installing caching plugins without actually identifying the bottleneck.
The result is predictable:
- Visitors wait.
- Pages feel unresponsive.
- Mobile users leave.
- Lead-generation pages lose conversions.
- Paid traffic becomes more expensive.
- Search performance can suffer when the overall page experience is poor.
- Developers spend hours "optimizing" things that were never the actual problem.
The right approach is not:
"How can I make my website faster?"
The better question is:
"Which part of my website is making it slow, and what is the highest-impact fix?"
This guide shows you how to diagnose that systematically.
First: What Does "Slow Website" Actually Mean?
Website speed is not one number.
A page can feel slow because:
- The server responds slowly.
- The browser has too much JavaScript to process.
- Images are too large.
- CSS prevents content from rendering quickly.
- Third-party scripts consume resources.
- Fonts load inefficiently.
- The website has too many redirects.
- The database is slow.
- Hosting resources are insufficient.
- Mobile devices cannot process the page efficiently.
So if someone says:
That is not enough information to diagnose the problem.
You need to know:
- Which page?
- Which device?
- Which network?
- First visit or repeat visit?
- How long does the server take to respond?
- What resources are taking the longest?
- Is the problem backend or frontend?
- Does the problem happen everywhere or only on one page?
That distinction changes the solution completely.
A Quick Website Speed Diagnosis Matrix
Before changing anything, identify the symptom.
| Symptom | Likely Cause |
|---|---|
| Every page is slow | Hosting, server, database, global scripts |
| Homepage is slow but other pages are fine | Hero media, page builder, animations, scripts |
| Mobile is much slower than desktop | Large assets, JavaScript, responsive implementation |
| First visit is slow but repeat visit is fast | Caching or initial resource loading |
| Server takes a long time before content appears | Hosting/backend/TTFB |
| Images appear very late | Image size, lazy loading, formats, CDN |
| Page becomes slow after adding tracking | Third-party scripts |
| WordPress admin is also slow | Database, plugins, hosting or backend |
| One landing page is extremely slow | Page-specific assets/scripts |
| Website slows down during traffic spikes | Hosting capacity or infrastructure |
| Checkout is slow | Database, API calls, payment integrations or scripts |
| Layout jumps while loading | Images/fonts without reserved dimensions |
The purpose of this table is simple:
Establish a Proper Baseline
Never optimize a website based on one test.
Test several important pages.
At minimum, check:
- Homepage
- Main service page
- Product/category page
- Blog article
- Contact page
- Lead-generation landing page
- Checkout or conversion page, if applicable
Then test them on:
- Mobile
- Desktop
- A slower connection
- A normal connection
- First visit
- Repeat visit
You are looking for patterns.
For example:
Scenario A
Homepage: slow Service pages: slow Blog: slow Contact: slow
This suggests a site-wide issue.
Scenario B
Homepage: slow Service pages: fast Blog: fast
This suggests a homepage-specific problem.
Scenario C
Desktop: acceptable Mobile: very slow
This points toward mobile assets, JavaScript, layout or responsive implementation.
The pattern itself is diagnostic information.
Determine Whether the Server or Browser Is the Problem
This is one of the most important distinctions.
Think of a website request like ordering food.
You place the order.
If the restaurant takes five minutes before even acknowledging your order, the problem is the kitchen/service system.
If the restaurant immediately gives you the food but you take ten minutes to unpack and arrange everything, the problem is on your side.
Websites work similarly.
Server-side delay
The browser requests the page.
The server takes a long time to start responding.
Potential causes:
- Poor hosting
- Slow database queries
- Heavy backend processing
- Plugin problems
- Server configuration
- Insufficient CPU/RAM
- External API delays
- Poor caching
Browser-side delay
The server responds reasonably quickly, but the browser still needs a long time to:
- Download JavaScript
- Execute JavaScript
- Download images
- Apply CSS
- Load fonts
- Render components
- Process third-party scripts
Potential causes:
- Large JavaScript bundles
- Heavy images
- Excessive CSS
- Page builders
- Animations
- Tracking scripts
- Chat widgets
- Social embeds
- Video players
This distinction prevents a common mistake:
Or the reverse:
Investigate Server Response Time
If the server is slow before the page starts arriving, investigate the backend.
Common causes include:
Cheap or overloaded hosting
Shared hosting can become a bottleneck when:
- Traffic increases
- Multiple websites share resources
- Database operations become heavier
- Plugins require more processing
- Server CPU or memory is constrained
Poorly optimized database
A CMS may repeatedly query a large database.
For example:
A website has accumulated:
- 50,000 post revisions
- Thousands of unused entries
- Large plugin tables
- Excessive logs
- Expired temporary data
The frontend may look simple while the backend is doing unnecessary work.
Heavy plugins
One poorly coded plugin can affect the entire website.
This is particularly important on CMS-based websites.
Don't ask:
Ask:
Five well-built plugins can be better than two badly implemented ones.
Audit Your Images
Images are one of the easiest places to find unnecessary page weight.
Consider a homepage hero image that is:
but displayed at roughly:
That is potentially a huge amount of unnecessary data.
A website may have:
- Large hero images
- Uncompressed product photos
- PNGs where JPEG/WebP/AVIF would work
- Images uploaded at original camera resolution
- Duplicate image sizes
- Background images loaded unnecessarily
What to check
For every important image ask:
- Is the image actually necessary?
- Is its pixel dimension appropriate?
- Is its file format appropriate?
- Is it compressed?
- Is it responsive?
- Does it need to load immediately?
- Can it be lazy-loaded?
- Is it being served through a CDN?
Don't Lazy-Load Everything
Lazy loading is useful, but it is not a universal solution.
Images below the initial viewport often make sense to load lazily.
But your main hero image may be part of the initial visual experience.
If the browser delays loading the most important content, you may create a different performance problem.
The goal is not:
The goal is:
That is a much better performance strategy.
Look at JavaScript
Modern websites can accumulate a surprising amount of JavaScript.
You may have scripts for:
- Analytics
- Tag managers
- Chat
- Heatmaps
- Forms
- Social sharing
- Reviews
- Popups
- Animations
- Sliders
- Page builders
- A/B testing
- Personalization
- Advertising
- CRM integrations
Individually, each script may seem harmless.
Together, they can create a heavy page.
The important question
Don't ask:
Ask:
A checkout page may need payment-related scripts.
A simple blog article probably does not need five interactive widgets.
Audit Third-Party Scripts
Third-party scripts deserve special attention because your website may depend on systems you do not control.
Examples:
- Google Analytics
- Advertising pixels
- Chat systems
- CRM forms
- Scheduling tools
- Social media embeds
- Review widgets
- Heatmaps
- Customer support tools
Suppose your page loads:
- 15 first-party requests
- 10 analytics requests
- 8 advertising requests
- 12 chat/widget requests
- 15 social or external requests
The website may technically be "optimized" internally while still being slow because of the external ecosystem.
Third-party script checklist
For each script:
If a script costs performance but nobody knows why it exists, investigate it.
Check CSS and Render-Blocking Resources
CSS tells the browser how the page should look.
But some CSS can prevent content from rendering efficiently.
Problems can include:
- Large CSS files
- Unused CSS
- Multiple stylesheets
- Page-builder CSS
- Theme CSS
- Component CSS
- Render-blocking resources
The objective is not simply to delete CSS.
The objective is to make sure the browser gets the CSS required to render the important content without unnecessary overhead.
Investigate Fonts
Fonts are frequently ignored during performance audits.
A website might load:
- Multiple font families
- Several weights
- Italic variants
- Multiple language subsets
- External font services
For example, a website may only visually use:
- Regular
- Medium
- Bold
but load:
- 100
- 200
- 300
- 400
- 500
- 600
- 700
- 800
- 900
That creates unnecessary requests and file weight.
Better approach
Load only the font families and weights that are genuinely required.
Also consider:
- Modern font formats
- Font-display behavior
- Self-hosting where appropriate
- Preloading only critical fonts
- Reducing unnecessary variants
Check Redirects
A user may request:
`example.com`
and the browser may be redirected through multiple versions before reaching the final page.
For example:
HTTP → HTTPS → www → canonical URL
Each unnecessary hop adds latency.
You want important URLs to reach their final destination efficiently.
Audit:
- HTTP → HTTPS
- www/non-www
- Trailing slash behavior
- Old URL redirects
- Tracking redirects
- Redirect chains
One redirect is not automatically a problem.
A long chain is.
Check Caching
Caching allows the website to avoid rebuilding or downloading the same things repeatedly.
Potential caching layers include:
- Browser cache
- Page cache
- Server cache
- Object cache
- CDN cache
Without appropriate caching, the server may repeatedly perform work that could have been reused.
For example:
A static blog page does not necessarily need to be generated from scratch for every visitor.
But don't confuse caching with diagnosis
Installing a caching plugin can improve performance.
It does not tell you why the website was slow.
You still need to identify the underlying bottleneck.
Check Your CDN and Geographic Performance
A website hosted in one geographic region can behave differently for users elsewhere.
A CDN can help distribute static assets closer to visitors.
This can be particularly useful for:
- Images
- CSS
- JavaScript
- Fonts
- Static files
But a CDN is not magic.
If your backend takes 3 seconds to generate a page, putting static images behind a CDN will not automatically turn the backend into a fast system.
Again:
Check Mobile Performance Separately
Desktop performance can create false confidence.
A powerful laptop on a fast broadband connection may make a heavy website feel acceptable.
A mid-range smartphone on a slower mobile connection is a different environment.
Mobile users may have:
- Less processing power
- Slower networks
- Smaller screens
- More expensive data
- Higher latency
- Less patience
So test mobile independently.
Look for:
- Oversized images
- Desktop assets being downloaded unnecessarily
- Heavy JavaScript
- Large menus
- Sliders
- Video backgrounds
- Animation libraries
- Popups
- Sticky elements
- Poorly optimized fonts
A page that scores well on desktop but struggles badly on mobile still has a real performance problem.
Understand the Waterfall
One of the most useful tools in website performance diagnosis is the network waterfall.
It shows what the browser requests and when those requests happen.
You are looking for patterns.
Pattern 1: Long initial wait
The browser waits before receiving the first meaningful response.
Potential issue:
Pattern 2: Huge image request
One image takes a significant amount of time to download.
Potential issue:
Pattern 3: Large JavaScript files
Several scripts consume significant download and processing time.
Potential issue:
Pattern 4: Many third-party domains
The page depends on many external services.
Potential issue:
Pattern 5: Long chain of dependent requests
One resource waits for another resource.
Potential issue:
The waterfall turns "the website feels slow" into something you can investigate.
Look at Core Web Vitals
Website performance is not just about total page load time.
You should also evaluate important user-experience signals such as:
- Largest Contentful Paint (LCP)
- Interaction to Next Paint (INP)
- Cumulative Layout Shift (CLS)
These help answer different questions.
LCP
How quickly does the main visible content appear?
If your hero section takes too long to become visually complete, investigate:
- Hero image
- Server response
- CSS
- Fonts
- Rendering
INP
How responsive does the page feel when users interact with it?
Poor interaction responsiveness can point toward:
- Heavy JavaScript
- Long tasks
- Event handlers
- Complex frontend applications
CLS
Does the page unexpectedly move while loading?
Common causes:
- Images without dimensions
- Ads
- Dynamic content
- Late-loading fonts
- Injected elements
For a deeper performance investigation, connect this article with your Core Web Vitals audit process.
Diagnose WordPress-Specific Problems
If your website uses WordPress, investigate the entire stack.
Potential sources include:
Theme
A feature-heavy theme may load functionality that your website does not need.
Visual builders can make development easier but may introduce additional DOM elements, CSS and JavaScript.
Plugins
Audit plugins for:
- Necessity
- Update status
- Duplicate functionality
- Frontend scripts
- Database activity
- Compatibility
Database
Investigate:
- Revisions
- Transients
- Autoloaded data
- Large tables
- Plugin-generated data
Hosting
A well-optimized WordPress site can still perform poorly on weak hosting.
Don't Ignore APIs and External Services
Modern websites increasingly depend on APIs.
For example:
A product page might request:
- Website server
- Product database
- Inventory API
- Pricing API
- Review API
- CRM
- Analytics
If one external service takes 2 seconds, the user may experience that delay even though your own code is efficient.
Check:
- API response time
- Timeout settings
- Number of requests
- Whether requests can run asynchronously
- Whether responses can be cached
- Whether the API is actually required for initial rendering
A Practical 20-Point Website Speed Checklist
Before redesigning or rebuilding a website, check these areas.
Server & Hosting
- Is server response time consistently slow?
- Is hosting capacity adequate?
- Are CPU/RAM resources being exhausted?
- Is backend processing unnecessarily heavy?
Images
- Are images compressed?
- Are dimensions appropriate?
- Are modern formats being used where suitable?
- Are non-critical images lazy-loaded?
Code
- Is JavaScript unnecessarily large?
- Is unused CSS being loaded?
- Are render-blocking resources excessive?
- Are unnecessary libraries being loaded?
Third Parties
- Are analytics and tracking scripts necessary?
- Are chat/review/social widgets justified?
- Can third-party scripts load later?
Infrastructure
- Is caching configured correctly?
- Is a CDN appropriate?
- Are there unnecessary redirects?
Mobile & UX
- Does the website perform acceptably on mobile?
- Are layout shifts and interaction delays being addressed?
This checklist is much more useful than simply asking whether your PageSpeed score is "good."
Example: Finding the Real Problem
Imagine an e-commerce website has:
- 20,000 monthly visitors
- 2.1% conversion rate
- Average order value: ₹2,500
The owner says:
You investigate.
The server responds reasonably quickly.
But the homepage contains:
- 3.8 MB hero image
- 1.4 MB promotional images
- Multiple slider assets
- Several third-party scripts
- A chat widget
- Multiple font weights
- Large JavaScript bundles
The server upgrade might help slightly.
But the bigger opportunity is frontend optimization.
After optimization, suppose the website moves from roughly 5 seconds of perceived loading to around 2.5–3 seconds for key pages.
If conversion rate improves from:
At 20,000 monthly visitors:
2.1% \= 420 orders
2.6% \= 520 orders
That's approximately:
At ₹2,500 average order value:
The exact outcome will vary, but this demonstrates why performance should be treated as a business problem, not just a developer score.
When Should You Fix the Website vs Rebuild It?
This is an important decision.
You do not always need a new website.
Fix the existing website when:
- Architecture is fundamentally sound.
- The CMS is appropriate.
- The codebase is manageable.
- Problems are mostly asset, caching or configuration related.
- The design still supports the business.
- SEO URLs can be preserved.
- The backend can be optimized.
Consider rebuilding when:
- The architecture is fundamentally inefficient.
- The website is difficult to maintain.
- The codebase is heavily customized and fragile.
- Performance problems are structural.
- The CMS is no longer appropriate.
- Mobile implementation is fundamentally broken.
- The website cannot support required functionality efficiently.
- Multiple systems have been patched together over time.
A rebuild should not be the default response to a slow website.
Mistakes to Avoid When Improving Website Speed
Chasing a perfect score
A 100 score is not the business objective.
The objective is a website that:
- Loads efficiently
- Responds quickly
- Works well on mobile
- Gives users a good experience
- Supports conversions
Installing random optimization plugins
More optimization plugins can sometimes create more complexity.
Use a controlled approach:
Compressing everything blindly
Not every asset needs aggressive compression.
Prioritize resources that affect the initial experience and high-value pages.
Removing analytics without understanding the impact
Analytics and tracking may be commercially important.
Instead of blindly removing them, investigate whether they can:
- Load later
- Load conditionally
- Be consolidated
- Be configured more efficiently
Optimizing only the homepage
Your homepage is important.
But your highest-value conversion page may actually be:
- A service page
- Product page
- Landing page
- Checkout
- Lead form
Optimize according to business importance, not just page popularity.
A Better Performance Optimization Process
Use this sequence:
Phase 1 — Measure
Test the real pages users care about.
Phase 2 — Diagnose
Identify whether the problem is:
Phase 3 — Prioritize
Estimate:
A 1 MB image on an obscure blog page may matter less than a 500 KB asset on your highest-converting landing page.
Phase 4 — Fix
Address the highest-impact bottleneck first.
Phase 5 — Retest
Run the same tests again.
Phase 6 — Monitor
Performance can degrade again after:
- New plugins
- New tracking tools
- New campaigns
- New content
- New images
- Website redesigns
- Feature additions
Performance is not a one-time project.
It is an ongoing quality metric.
Build a Performance Budget
A useful way to prevent performance degradation is to define a performance budget.
For example, your team could establish targets such as:
- Avoid unnecessarily large page weight
- Keep critical images optimized
- Minimize unnecessary third-party scripts
- Limit JavaScript growth
- Keep key pages responsive on mobile
- Maintain acceptable Core Web Vitals
- Test performance before major releases
The exact numbers should depend on your website, technology and business requirements.
The important part is having a standard that developers and marketers both respect.
The Most Important Question: Which Pages Matter Most?
Don't optimize every page equally.
Start with pages that influence revenue.
For a service business:
- Homepage
- Main service pages
- Lead-generation landing pages
- Contact page
- High-traffic blog pages
For e-commerce:
- Homepage
- Category pages
- Product pages
- Cart
- Checkout
For paid acquisition:
- Ad landing pages
- Lead forms
- Product/service pages
- Conversion confirmation flow
Performance optimization should follow the customer journey.
How Website Speed Connects to SEO, CRO and Paid Ads
Website speed is not an isolated development task.
It connects directly with other parts of digital growth.
Your SEO architecture determines how users and search engines navigate the website.
Your mobile experience determines whether visitors can comfortably interact with pages.
Your landing page structure determines whether paid traffic converts.
Your Core Web Vitals reveal important aspects of real-world page experience.
Your information architecture determines how efficiently users move from discovery to action.
That is why website performance should be considered part of the complete digital growth system.
SEO Publishing Information
| Field | Details |
|---|---|
| Blog ID | WEB-07 |
| Category | Web Development |
| Stage | Diagnose |
| Primary Keyword | why is my website slow |
| Supporting Keywords | website speed problems; slow website diagnosis; improve website load time |
| Search Intent | Problem Solving |
| Funnel Stage | Problem Aware |
| Pillar Page | Web Development Services |
| Suggested URL | `/blog/why-is-my-website-slow-a-step-by-step-performance-diagnosis` |
| Content Role | Diagnostic / problem-solving resource |
| Publishing Sprint | Sprint 5 |
| CTA | Request a website audit / Explore Web Development |
| Meta Title | Why Is My Website Slow? Step-by-Step Speed Diagnosis |
| Meta Description | Find out why your website is slow with a practical diagnosis covering hosting, images, code, caching, third-party scripts, mobile UX and Core Web Vitals. |
| H1 | Why Is My Website Slow? A Step-by-Step Performance Diagnosis |
Recommended CTA
Get a website performance audit that identifies the real bottlenecks across hosting, frontend assets, code, mobile performance, third-party scripts and Core Web Vitals.