
Your website can have a beautiful design, excellent content, strong SEO and a powerful offer—and still provide a frustrating experience.
A page may technically "load," but the visitor is still waiting for the main content.
Or the page appears ready, but clicking a button feels delayed.
Or the user starts reading and suddenly the entire page jumps because an image, banner or font loaded late.
These are not simply "speed problems."
They are user-experience and performance problems.
This is where Core Web Vitals become useful.
But there is an important distinction:
It is about finding out what is actually slowing down or destabilizing the experience—and why.
A good audit should take you from:
rather than:
This guide explains how to perform that diagnosis.
What Are Core Web Vitals?
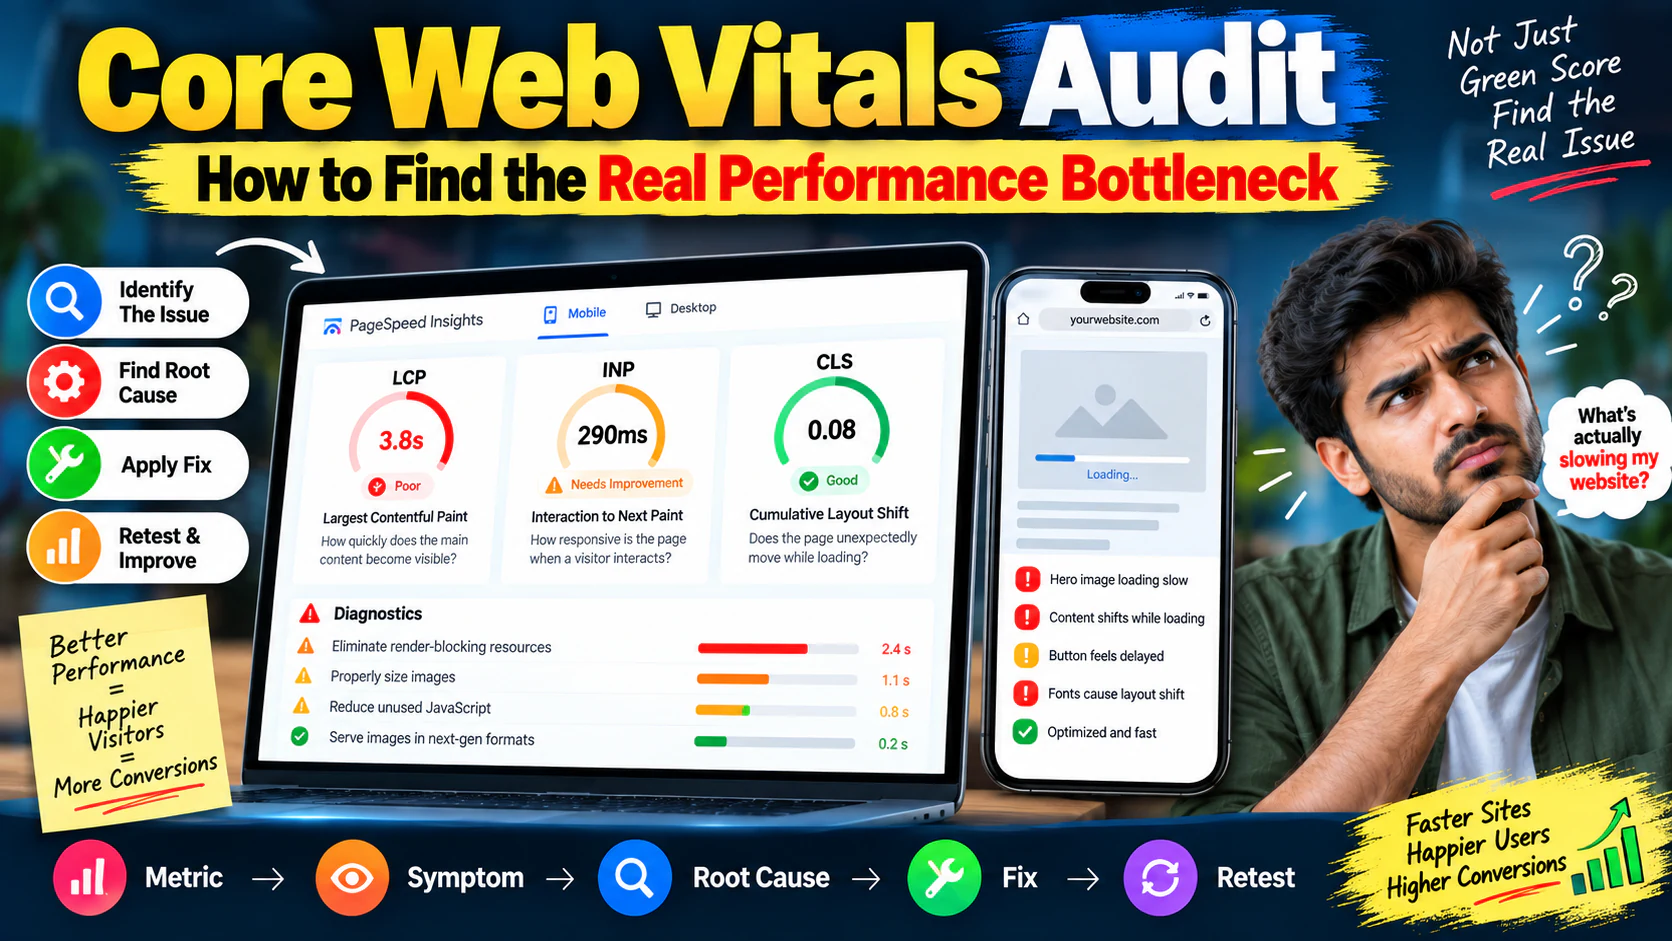
Core Web Vitals are performance signals designed to evaluate important aspects of the real user experience of a webpage.
The three key metrics are:
- LCP — Largest Contentful Paint
- INP — Interaction to Next Paint
- CLS — Cumulative Layout Shift
Each tells you something different.
LCP asks:
INP asks:
CLS asks:
These metrics should therefore not be treated as three variations of "page speed."
They diagnose different experiences.
Why a Core Web Vitals Score Is Not Enough
Suppose your audit reports:
That does not tell you what to fix.
The real problem might be:
- Slow server response
- Large hero image
- Render-blocking CSS
- Web font delay
- JavaScript execution
- Poor resource prioritization
Similarly:
does not automatically mean "reduce JavaScript."
You need to determine:
- Which interaction is slow?
- Which element was clicked?
- What JavaScript was executing?
- Was there a long task?
- Is the event handler expensive?
- Is the browser overloaded?
And:
doesn't mean "make the website smaller."
It may mean:
- Images have no reserved dimensions.
- A banner is injected after page load.
- Fonts cause text reflow.
- An ad slot changes height.
- Dynamic content pushes existing content downward.
The metric tells you where to investigate.
It does not necessarily tell you the final solution.
The Three Core Web Vitals at a Glance
| Metric | What It Measures | Common Problems |
|---|---|---|
| LCP | Loading performance of the main content | Slow server, hero image, CSS, fonts |
| INP | Interaction responsiveness | Heavy JavaScript, long tasks, complex UI |
| CLS | Visual stability | Images, fonts, ads, dynamic elements |
This is the foundation of a useful Core Web Vitals audit.
Start With the Page, Not the Score
Choose the actual pages that matter to the business.
For a service company:
- Homepage
- Service pages
- Lead-generation pages
- Contact page
- High-traffic articles
For e-commerce:
- Homepage
- Category pages
- Product pages
- Cart
- Checkout
For paid advertising:
- Campaign landing pages
- Product pages
- Lead forms
- Conversion pages
Do not assume the homepage represents the entire website.
A website can have:
or:
or:
The audit must reflect the pages users actually visit.
Separate Field Data From Lab Testing
One of the most important concepts in performance analysis is understanding the difference between real-user data and controlled testing.
Field data
Field data comes from actual users and their devices, networks and browsing environments.
This can reveal how the website performs in the real world.
Lab data
Lab testing uses a controlled testing environment.
It is useful because you can repeatedly test after making changes.
The two approaches serve different purposes.
Think of it this way:
You want both whenever the available data supports it.
Diagnose LCP
LCP is often where website owners first notice a performance problem.
Imagine someone opens your website.
The browser begins loading.
The header appears.
Then the navigation.
Then some blank space.
Then, several seconds later, the large hero heading and image finally become visible.
The visitor doesn't care that the header loaded quickly.
They are waiting for the main content.
That's why LCP matters.
What Commonly Causes Poor LCP?
There are four major areas to investigate.
Slow server response
If the server takes too long to return the initial document, everything downstream gets delayed.
Investigate:
- Hosting
- Server configuration
- Backend processing
- Database queries
- Caching
- CDN configuration
If the initial response itself is slow, optimizing your hero image won't solve the whole problem.
Slow LCP resource
The LCP element is often:
- Hero image
- Large heading
- Banner
- Product image
- Featured content block
If the LCP element is an image, investigate:
- File size
- Format
- Dimensions
- Compression
- Loading priority
- CDN delivery
- Responsive image selection
A 3 MB hero image is a very different performance problem from a 150 KB optimized asset.
Render-blocking CSS
The browser may have the HTML but still cannot display the important content because it is waiting for required styles.
Investigate:
- Large CSS files
- Unused CSS
- CSS dependencies
- Page-builder styles
- Render-blocking resources
Fonts
A visually important heading may depend on a web font.
If the font loads late, the browser may delay or change how the content is rendered.
Investigate:
- Number of font files
- Font weights
- Font loading behavior
- External font requests
- Preloading strategy
Do not preload every font.
Prioritize only what genuinely contributes to the initial experience.
LCP Diagnostic Decision Tree
If LCP is poor, ask:
This is far more useful than simply saying:
Diagnose INP
INP is about interaction responsiveness.
Consider this experience:
A visitor clicks:
Nothing appears to happen.
They click again.
Still nothing.
Then the interface suddenly responds.
From the visitor's perspective, the website feels broken.
The issue may not be loading speed at all.
It may be JavaScript responsiveness.
What Causes Poor Interaction Responsiveness?
Common causes include:
- Large JavaScript bundles
- Excessive JavaScript execution
- Long-running tasks
- Complex event handlers
- Heavy page builders
- Large DOM structures
- Excessive third-party scripts
- Inefficient frontend components
- Expensive calculations during interaction
The important point is:
That's why measuring only page load time is incomplete.
How to Investigate a Slow Interaction
Suppose a menu takes too long to open.
Don't immediately optimize the entire website.
Investigate the specific interaction.
Ask:
- What element was clicked?
- What JavaScript ran after the click?
- Was there a long task?
- How much JavaScript was executed?
- Did another script run at the same time?
- Is the interaction unnecessarily complicated?
- Does the same problem happen on mobile?
This makes debugging much more targeted.
Example: A Slow "Get Quote" Button
Imagine a service website has a button:
Clicking it triggers:
- Popup library
- Animation library
- CRM integration
- Analytics event
- Form validation
- Chat widget
- Personalization script
The button itself looks simple.
But clicking it can trigger a chain of operations.
Instead of saying:
The developer should investigate:
That distinction can save hours of unnecessary optimization.
Diagnose CLS
CLS is different.
It is about visual stability.
Imagine this:
You open an article.
You start reading.
Then an image loads.
The text moves down.
You continue reading.
Then a banner appears.
The content shifts again.
You click what you think is a button.
The page moves.
You accidentally click something else.
That is a poor experience.
Common Causes of Layout Shift
Images without reserved dimensions
If the browser doesn't know how much space an image needs before it loads, surrounding content can move.
Reserve the appropriate space for media.
Advertisements
Dynamic advertising areas can change page layout if dimensions aren't properly reserved.
Banners
Cookie notices, promotional banners and announcements can appear after the page begins rendering.
If their space isn't accounted for, content can shift.
Fonts
Late-loading fonts can change text dimensions and cause layout movement.
Dynamic content
Examples:
- Product recommendations
- Reviews
- Related articles
- Personalization
- API-driven content
If these elements are injected into the page without reserving space, existing content can move.
CLS Diagnostic Question
When you see layout shift, ask:
That usually gives you a much faster path toward the root cause.
Identify the Actual LCP Element
One of the most useful things you can do during an audit is determine exactly which element is being measured as LCP.
It might be:
- An image
- A heading
- A paragraph
- A video poster
- A banner
- A large content block
Once you know the element, diagnosis becomes much easier.
For example:
LCP = Hero image
Investigate image delivery.
LCP = Main heading
Investigate:
- Server response
- CSS
- Fonts
- Rendering
LCP = Large banner
Investigate:
- Banner loading
- Third-party content
- CSS
- Dynamic rendering
Never optimize an LCP metric without knowing what created it.
Inspect the Critical Rendering Path
The browser doesn't simply download everything at once.
Resources have dependencies.
For example:
HTML ↓ CSS ↓ Font ↓ Layout ↓ Paint
HTML ↓ JavaScript ↓ Component rendering ↓ Content display
Your job is to identify which resources are critical and which can wait.
Critical resources
Resources required to display the initial experience.
Non-critical resources
Resources that can load later without damaging the initial experience.
Examples of potentially deferrable content include:
- Below-the-fold images
- Chat widgets
- Social feeds
- Some analytics functionality
- Secondary interactive components
The goal is:
Audit Third-Party JavaScript
Third-party scripts are a frequent source of hidden performance costs.
You may have:
- Analytics
- Advertising pixels
- CRM
- Chat
- Heatmaps
- Reviews
- Social widgets
- A/B testing
- Appointment systems
Ask of every script:
Why is it installed?
Is it still required?
Does it need to run on every page?
Does it need to load immediately?
Can it be delayed?
Can it be triggered only after interaction?
Does it generate measurable business value?
If a script adds meaningful revenue or measurement value, optimize how it loads rather than blindly removing it.
If nobody knows why it exists, investigate it.
Compare Desktop and Mobile
A common mistake is auditing only desktop.
The same page may behave very differently on mobile.
For example:
Desktop:
- 2.2 second LCP
- Good interaction
- Stable layout
Mobile:
- 5.1 second LCP
- Heavy JavaScript
- Large image
- Layout shifts
The underlying page may be identical.
The user experience isn't.
Mobile devices generally have different:
- Processing capabilities
- Network conditions
- Screen sizes
- Memory constraints
- Input methods
Therefore:
For a deeper mobile-specific investigation, connect this article to your Mobile Website Audit resource.
Investigate JavaScript Before Blaming Hosting
A common optimization mistake looks like this:
But suppose:
- Server response \= acceptable
- HTML \= small
- Images \= optimized
- JavaScript \= enormous
- Main thread \= overloaded
The hosting upgrade may produce very little improvement.
This is why performance diagnosis needs to separate:
Look for Long Tasks
A browser can become unresponsive when JavaScript performs a large amount of work without yielding.
Long tasks can affect:
- Clicks
- Menus
- Forms
- Filters
- Search
- Popups
- Navigation
- Product interactions
If INP is poor, investigate what the browser is doing during the interaction.
You may discover that a simple click triggers an unexpectedly large amount of work.
Review the DOM
A visually simple page can contain a surprisingly complicated HTML structure.
Page builders and component-heavy websites can generate:
- Nested containers
- Wrapper elements
- Hidden components
- Duplicate structures
- Large navigation trees
- Unnecessary markup
A larger DOM is not automatically bad.
But unnecessary complexity can make rendering and interaction more expensive.
The question is:
If a decorative component creates substantial processing cost but contributes nothing to conversions or usability, reconsider it.
Audit Images for Both LCP and CLS
Images affect more than one performance metric.
Image too large
Image loads without reserved dimensions
Wrong responsive size
Too many above-the-fold images
Background image used unnecessarily
So image optimization should be part of the Core Web Vitals audit, not treated as a separate afterthought.
Audit Fonts Carefully
Fonts can affect:
- LCP
- CLS
- Rendering
- Visual consistency
A website might load:
- 4 font families
- 8 weights
- Multiple subsets
- External font providers
when it really needs:
- 1 family
- 3 weights
Reducing unnecessary font requests can simplify the loading process.
But again, don't blindly remove fonts.
Maintain the visual identity while reducing unnecessary performance cost.
Check Caching
Caching can improve the time required to retrieve frequently requested resources.
Review:
- Browser caching
- Page caching
- Server caching
- Object caching
- CDN caching
For content-heavy websites, effective caching can reduce repeated server processing.
But remember:
If your database query takes too long or your JavaScript is bloated, caching alone won't solve the complete problem.
Use a Waterfall to Find Dependencies
The network waterfall is one of the best ways to understand how resources are being loaded.
Look for:
Long initial response
Potential server problem.
Large image request
Potential asset problem.
CSS blocking important resources
Potential rendering problem.
Large JavaScript files
Potential frontend problem.
Many third-party requests
Potential external dependency problem.
Sequential requests
Potential dependency or loading-order problem.
A waterfall turns a vague complaint like:
into:
That is actionable.
Create a Bottleneck Map
Instead of creating a long list of 50 random recommendations, group problems by root cause.
| Bottleneck | Evidence | Likely Fix |
|---|---|---|
| Server | Slow initial response | Hosting/backend/cache investigation |
| Hero image | Large LCP resource | Resize/compress/modern delivery |
| CSS | Rendering delayed | Reduce/defer non-critical CSS |
| JavaScript | Slow interaction | Reduce/defer/optimize execution |
| Third-party | External requests | Delay, remove or conditionally load |
| Fonts | Late text rendering | Reduce variants/optimize loading |
| Images | Layout movement | Reserve dimensions |
| Dynamic content | Content jumps | Reserve space before insertion |
| Mobile | Poor mobile experience | Optimize mobile assets and processing |
This gives developers a prioritized roadmap.
A Practical Core Web Vitals Audit Workflow
Use this sequence.
Phase 1 — Select
Choose your highest-value pages.
Phase 2 — Test
Run controlled performance tests across desktop and mobile.
Phase 3 — Compare
Compare the results across page types.
Phase 4 — Identify
Find the LCP element, slow interactions and layout shifts.
Phase 5 — Investigate
Use resource timing, waterfall information and browser diagnostics to locate the root cause.
Phase 6 — Prioritize
Rank fixes by:
Phase 7 — Implement
Fix the highest-impact bottleneck first.
Phase 8 — Retest
Run the same tests after implementation.
Phase 9 — Monitor
Watch real-world performance after deployment.
Example: A Service Website With Poor LCP
Imagine a service company has a landing page with:
- Hero image: 2.8 MB
- Multiple animation libraries
- Three font families
- Chat widget
- Analytics
- CRM form
- Large CSS bundle
The performance report shows poor LCP.
A weak optimization approach might be:
A better diagnosis is:
Server
Acceptable.
LCP element
Hero image.
Hero image
Too large.
CSS
Several unnecessary styles loaded.
Fonts
More variants than necessary.
Third-party
Chat widget loads immediately.
Now there is a clear action plan:
- Optimize hero image.
- Ensure the correct responsive image is served.
- Reduce non-critical CSS.
- Reduce unnecessary font variants.
- Delay the chat widget.
- Retest LCP.
That's performance engineering based on evidence rather than guesswork.
Example: Poor INP on an E-Commerce Website
Imagine a product filtering interface.
Users click:
The interface takes noticeably long to respond.
The website owner says:
But the page may actually load quickly.
The issue is the filter interaction.
Investigation reveals:
- Large JavaScript bundle
- Expensive filtering operation
- Multiple UI components re-rendering
- Analytics event firing during the interaction
The correct solution is not necessarily faster hosting.
It may involve:
- Reducing JavaScript work
- Optimizing the filter logic
- Limiting unnecessary re-renders
- Moving non-critical work away from the interaction
This is why INP requires interaction-level diagnosis.
Example: Poor CLS on a Blog
A blog article looks fine initially.
Then:
- Advertisement loads
- Newsletter banner appears
- Images load
- Font changes
- Related content is inserted
The content moves several times.
The fix is not simply:
You may need to:
- Reserve image space
- Reserve ad space
- Allocate banner dimensions
- Improve font loading
- Prevent unexpected content insertion
The root cause is layout instability.
Don't Treat Every Performance Problem the Same
A useful mental model is:
LCP problem
INP problem
CLS problem
That simple distinction can dramatically improve your diagnosis.
Core Web Vitals Audit Checklist
Before declaring a website "optimized," check:
LCP
- Is the server responding efficiently?
- What is the LCP element?
- Is the LCP asset too large?
- Is the correct responsive asset being served?
- Are important CSS resources blocking rendering?
- Are fonts delaying important content?
- Are unnecessary scripts competing for resources?
INP
- Which interactions are slow?
- Are there long JavaScript tasks?
- Is the main thread overloaded?
- Are event handlers expensive?
- Are third-party scripts running during interaction?
- Is the DOM unnecessarily complex?
- Can non-critical work be deferred?
CLS
- Do images reserve space?
- Do videos reserve space?
- Do ads have defined dimensions?
- Do banners cause movement?
- Are fonts causing reflow?
- Does dynamic content appear without reserved space?
Infrastructure
- Is caching configured properly?
- Is the CDN appropriate?
- Is hosting sufficient?
- Are backend/API calls slow?
Mobile
- Does the problem become worse on mobile?
- Are mobile users receiving unnecessarily large assets?
- Is JavaScript too expensive for mobile devices?
- Are interactions comfortable on touch devices?
What Not to Do
Don't chase a perfect score
A performance score is a diagnostic signal, not the business objective.
Don't optimize blindly
Every major optimization should have a reason.
Instead of:
Ask:
Don't blame hosting automatically
A fast server cannot compensate for a huge frontend.
Don't remove every third-party script
Some scripts support:
- Measurement
- Advertising
- Lead generation
- Customer support
- Revenue
Optimize them intelligently.
Don't focus only on desktop
Mobile users can experience completely different bottlenecks.
Don't make changes without retesting
If you change five things simultaneously and performance improves, you may not know which change produced the result.
Where practical:
How Core Web Vitals Connect to SEO and Conversions
Performance should not exist in a separate technical department.
It affects the broader website experience.
For SEO, technical quality and site architecture influence how efficiently search engines and users navigate your website.
For conversion optimization, a slow or unstable page can create friction between a visitor and the action you want them to take.
For paid traffic, performance matters even more because every delayed landing-page experience is happening after you have already paid to bring the visitor there.
For example:
If the landing page is slow, you're potentially paying for visitors who leave before they can even evaluate the offer.
That is why Core Web Vitals should be considered part of a broader website performance and conversion system.
When Should You Perform a Core Web Vitals Audit?
Consider a structured audit when:
- Website performance has recently declined.
- A redesign was launched.
- A new page builder was introduced.
- New tracking tools were added.
- A website migration was completed.
- Mobile performance is poor.
- Users complain about slow interactions.
- Layout shifts are visible.
- Important landing pages are underperforming.
- SEO performance has changed alongside technical website changes.
- Your website has accumulated years of plugins, scripts and content.
You should also retest after major technical changes.
The Real Goal of a Core Web Vitals Audit
The goal isn't:
The goal is:
That requires connecting performance metrics to real causes.
A useful audit should finish with something like:
Problem: Poor LCP on service landing pages Evidence: Large hero asset + delayed rendering Root Cause: Oversized image and unnecessary CSS Priority: High Action: Optimize hero asset, improve loading priority and reduce non-critical CSS Expected Outcome: Faster initial content rendering
That is much more valuable than:
"PageSpeed score: 62. Improve performance."
SEO Publishing Information
| Field | Details |
|---|---|
| Blog ID | WEB-08 |
| Category | Web Development |
| Stage | Diagnose |
| Primary Keyword | Core Web Vitals audit |
| Supporting Keywords | Core Web Vitals checklist; website performance audit; Core Web Vitals diagnosis |
| Search Intent | Problem Solving |
| Funnel Stage | Problem Aware |
| Pillar Page | Web Development Services |
| Suggested URL | `/blog/core-web-vitals-audit-how-to-find-the-real-performance-bottleneck` |
| Content Role | Diagnostic / performance resource |
| Publishing Sprint | Sprint 5 |
| CTA | Request a website audit / Explore Web Development |
| Meta Title | Core Web Vitals Audit: Find the Real Performance Bottleneck |
| Meta Description | Learn how to audit Core Web Vitals, diagnose LCP, INP and CLS problems, identify the real bottleneck and prioritize the right website performance fixes. |
| H1 | Core Web Vitals Audit: How to Find the Real Performance Bottleneck |
Recommended CTA
Don't guess at the fix. Get a structured website performance audit that identifies the actual bottleneck across server response, images, CSS, JavaScript, third-party scripts, mobile performance and rendering.