
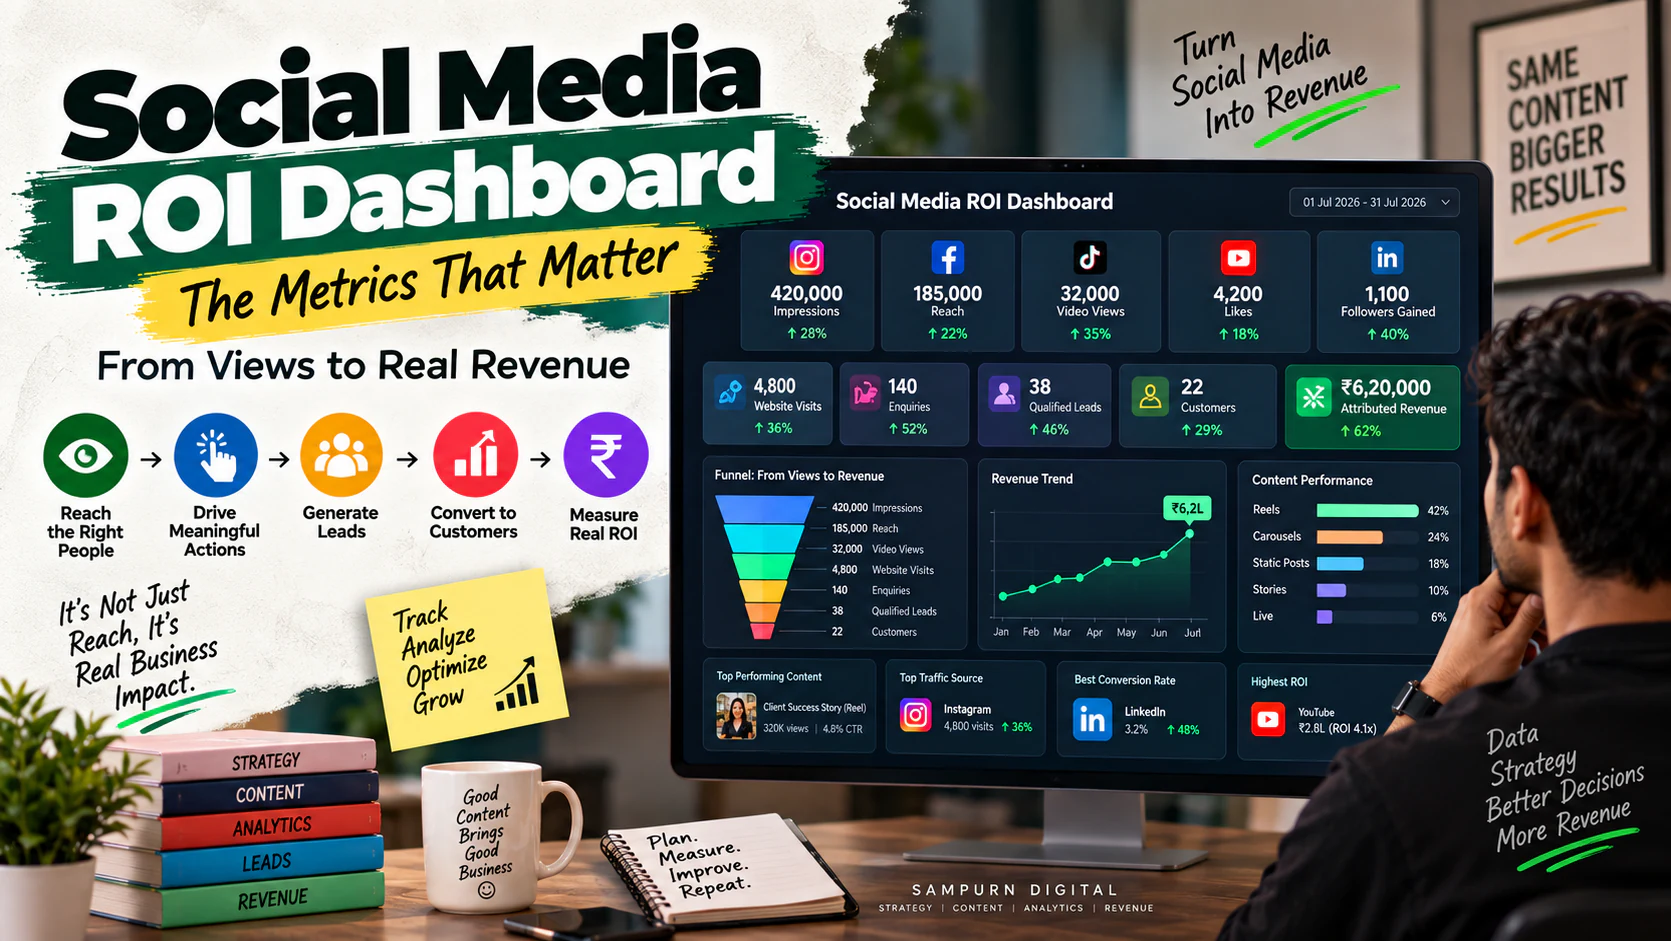
Your monthly social media report says:
- 420,000 impressions
- 185,000 reach
- 32,000 video views
- 4,200 likes
- 1,100 followers gained
It looks impressive.
Then the business owner asks:
And suddenly the report becomes much less useful.
This is the problem with many social media dashboards.
They are built around platform activity, not business outcomes.
A useful social media ROI dashboard should help you answer five questions:
- Are we reaching the right people?
- Are they taking meaningful actions?
- Are those actions generating leads?
- Are those leads becoming customers?
- Is the business getting enough return for the resources invested?
The goal isn't to remove likes, views and reach from your reporting.
The goal is to put them in the right place.
What Is a Social Media ROI Dashboard?
A social media ROI dashboard is a reporting system that brings together the metrics needed to evaluate social media performance against business objectives.
It can combine:
- Organic social data
- Paid social data
- Website traffic
- Leads
- Qualified leads
- Sales opportunities
- Customers
- Revenue
- Marketing costs
The important part is the connection between them.
A dashboard that says:
“Instagram generated 300,000 views”
is a social media report.
A dashboard that says:
“Instagram generated 4,800 website visits, 140 enquiries, 38 qualified opportunities and ₹6.2 lakh in attributed revenue”
is much closer to a business dashboard.
Why Most Social Media Dashboards Fail
There are four common problems.
Too many metrics
The dashboard contains 40 numbers.
Nobody knows which ones matter.
Vanity metrics dominate
Followers and impressions occupy the top of the report.
Revenue appears on page 4.
No funnel connection
Reach isn't connected to traffic.
Traffic isn't connected to leads.
Leads aren't connected to sales.
No decision-making layer
The report tells you what happened.
It doesn't tell you:
A good dashboard should reduce confusion, not create more of it.
The Social Media ROI Dashboard Framework
Build your dashboard in six layers:
Then add a seventh section:
This final section is what turns reporting into management.
Layer 1: Visibility Metrics
These tell you whether your content is getting attention.
Track:
- Reach
- Impressions
- Video views
- Follower growth
- Non-follower reach
- Content frequency
But don't treat these as proof of business success.
For example:
That's useful.
But the next question should be:
If reach goes up while qualified leads fall, the result may not be positive.
Reach vs Impressions
These numbers are often confused.
Reach
Approximate number of unique accounts exposed to content.
Impressions
Total number of times content was displayed.
For example:
This indicates content was displayed multiple times across the audience.
A simple frequency calculation is:
So:
250,000 ÷ 100,000 \= 2.5
This can help you understand how often your content was being seen.
Layer 2: Engagement Metrics
Now measure what people did with the content.
Useful metrics include:
- Saves
- Shares
- Comments
- Likes
- Profile visits
- Video watch time
- Completion rate
- Engagement rate
But again, don't assume:
A funny Reel may get thousands of likes.
A niche case study may get 30 likes but generate 6 enquiries.
They serve different jobs.
Saves and Shares Can Be More Informative Than Likes
Likes often represent lightweight approval.
Saves and shares can indicate stronger content utility or relevance.
For example:
A business publishes:
“10 mistakes to avoid before running Google Ads.”
People may save it because they expect to use it later.
Another person may share it with a business partner.
Those actions can provide useful signals about content relevance.
Still, don't automatically assign revenue value to saves or shares.
They are indicators—not sales.
Engagement Rate
A simple engagement rate can be calculated as:
Suppose:
Engagements \= 2,500
Reach \= 50,000
Then:
2,500 ÷ 50,000 × 100
\= 5%
Use the same calculation consistently when comparing content.
Different platforms and reporting systems may define engagement differently, so document exactly what your dashboard includes.
Layer 3: Traffic Metrics
This is where social media starts connecting with your website.
Track:
- Profile visits
- Link clicks
- Website sessions
- Landing-page sessions
- Engaged sessions
- Landing-page conversion rate
The goal is to understand:
Don't Measure Clicks Without Looking at Landing Pages
Suppose a Reel generates:
Sounds excellent.
But if the landing page generates:
your traffic may not be as valuable as the click number suggests.
Calculate:
If:
10,000 sessions
20 leads
then:
20 ÷ 10,000 × 100
\= 0.2%
That should trigger an investigation.
Possible problems include:
- Message mismatch
- Weak offer
- Poor landing page
- Wrong audience
- Weak CTA
- Slow experience
- Excessive form friction
Layer 4: Lead Metrics
Now move from traffic to actual business actions.
Track:
- Total leads
- Leads by platform
- Leads by campaign
- Leads by content
- Cost per lead
- Qualified leads
- Qualified lead rate
- Cost per qualified lead
For many service businesses, this is where social media reporting becomes much more commercially meaningful.
Define What Counts as a Lead
Don't let every interaction become a "lead."
For example:
| Action | Lead? |
|---|---|
| Like | No |
| Follow | No |
| Comment | Usually no |
| Profile visit | No |
| Website visit | No |
| Contact form | Yes |
| Consultation booking | Yes |
| Quote request | Yes |
| Sales enquiry | Yes |
| Purchase | Customer |
Your business may define these differently.
The important thing is consistency.
Qualified Lead Rate
Suppose social media generated:
and:
Then:
This tells you how much of your lead volume is commercially relevant.
Now compare campaigns.
Campaign A
100 leads 15 qualified
Qualified rate \= 15%
Campaign B
60 leads 24 qualified
Qualified rate \= 40%
Campaign B generates fewer leads but significantly better lead quality.
That is exactly the kind of insight a dashboard should reveal.
Cost Per Qualified Lead
For paid social, calculate:
Suppose:
Spend \= ₹60,000
Qualified leads \= 30
Then:
This is usually much more useful than celebrating a ₹300 CPL when only a small percentage of those leads are relevant.
Layer 5: Sales Metrics
Marketing dashboards often stop at leads.
That's a mistake.
If your CRM allows it, track:
- Sales opportunities
- Proposals
- Deals won
- Deals lost
- Customer acquisition
- Average deal value
- Sales conversion rate
Now you can identify whether social media is generating sales opportunities, not simply enquiries.
Lead-to-Customer Rate
Suppose:
Then:
And:
These numbers can reveal where the funnel needs improvement.
Layer 6: Revenue
This is the layer that makes the dashboard a true ROI dashboard.
Track where possible:
- Revenue
- Revenue by campaign
- Revenue by platform
- Revenue by customer segment
- Average deal value
- Revenue per lead
- Revenue per qualified lead
For e-commerce, revenue may be available relatively quickly.
For B2B or high-ticket services, revenue may occur weeks or months after the initial social interaction.
Your reporting system needs to account for that sales cycle.
Revenue Per Lead
Use:
Suppose:
Revenue \= ₹5,00,000
Leads \= 200
Then:
₹5,00,000 ÷ 200
\= ₹2,500 revenue per lead
This doesn't mean every lead is literally worth ₹2,500.
It's an aggregate efficiency metric.
Use it to compare performance over time.
Customer Acquisition Cost
If your social acquisition costs can be measured:
Suppose:
Social marketing cost \= ₹1,50,000
Customers acquired \= 10
Then:
Now compare this against the economics of the customer.
If average gross contribution from a customer is ₹50,000, the acquisition economics may be attractive.
If it is ₹8,000, you have a problem.
The exact financial interpretation depends on your margins and business model.
Social Media ROI
A basic ROI formula is:
Suppose:
Revenue attributable to social \= ₹5,00,000
Investment \= ₹1,25,000
Then:
ROI \=
(₹5,00,000 − ₹1,25,000) ÷ ₹1,25,000 × 100
\= 300%
But there is an important qualification.
Revenue is not always the same as profit.
If you want a true profitability calculation, use the financial contribution that your business considers appropriate rather than blindly using gross revenue.
ROAS vs ROI
These are not the same.
ROAS
If:
Revenue \= ₹5,00,000
Ad spend \= ₹1,00,000
ROAS \= 5×
ROI
Considers investment and return more broadly.
It can include:
- Ad spend
- Agency fees
- Production
- Software
- Other relevant costs
So a campaign can have:
while producing a much lower overall ROI once total marketing costs are included.
Build the Dashboard Around Business Questions
Don't start by asking:
“What metrics can we collect?”
Start with:
Question 1
Are we reaching the right audience?
Question 2
Which content creates meaningful engagement?
Question 3
Which content drives traffic?
Question 4
Which traffic sources generate leads?
Question 5
Which leads become qualified?
Question 6
Which campaigns generate customers?
Question 7
Which activities generate revenue efficiently?
Your dashboard should answer these questions quickly.
Recommended Dashboard Layout
Section A — Executive Summary
| KPI | Current | Previous | Change |
|---|---|---|---|
| Reach | 250K | 210K | +19% |
| Website sessions | 6K | 5K | +20% |
| Leads | 180 | 145 | +24% |
| Qualified leads | 54 | 39 | +38% |
| Customers | 9 | 7 | +29% |
| Revenue | ₹5.4L | ₹4.1L | +32% |
This should be the first thing management sees.
Section B — Content Performance
Track your top content by business objective.
| Content | Reach | Saves | Shares | Visits | Leads |
|---|---|---|---|---|---|
| Reel A | 80K | 450 | 120 | 500 | 12 |
| Reel B | 35K | 620 | 180 | 650 | 18 |
| Case Study | 18K | 210 | 80 | 420 | 21 |
| Carousel | 25K | 390 | 95 | 300 | 8 |
Notice something important.
The case study has lower reach than Reel A.
But it generates more leads.
That is exactly why reach alone shouldn't determine what content you produce next.
Section C — Lead Funnel
Show:
For example:
250,000
6,000
180
54
24
9
Now you can see the complete journey.
Section D — Paid Social Performance
Track:
- Spend
- Impressions
- CPM
- CTR
- CPC
- Landing-page conversion rate
- Leads
- CPL
- Qualified leads
- Cost per qualified lead
- Customers
- CAC
- Revenue
- ROAS
This creates a much stronger connection between ad platform data and business results.
For deeper paid reporting, connect this dashboard with a weekly paid ads performance dashboard.
Section E — Organic Social Performance
Track:
- Reach
- Non-follower reach
- Engagement
- Saves
- Shares
- Profile visits
- Website clicks
- Leads
- Assisted conversions where measurable
The exact metrics depend on your content strategy.
Section F — Revenue & ROI
This section should answer:
Track:
- Revenue
- Marketing investment
- Revenue per lead
- Revenue per qualified lead
- CAC
- ROAS
- ROI
If attribution is imperfect, label the numbers clearly.
For example:
versus
Don't present estimates as exact revenue.
Section G — Insights and Actions
This is the most underrated section.
Include:
What worked?
Case-study content generated the highest qualified lead rate.
What declined?
Promotional Reels generated less website traffic.
What changed?
Qualified lead rate increased from 22% to 31%.
What should happen next?
Increase production of high-intent case studies and problem-focused content.
Now the dashboard becomes a management tool.
Use Traffic-Light Logic Carefully
You can classify metrics as:
Healthy
Meeting or exceeding target.
Watch
Moving in the wrong direction.
Action required
Significant deterioration or business risk.
For example:
| Metric | Status | Action |
|---|---|---|
| Reach | Healthy | Maintain |
| Website CVR | Watch | Test landing page |
| Qualified lead rate | Healthy | Scale winning content |
| CAC | Action required | Review targeting |
| Revenue | Healthy | Continue investment |
Avoid making colors the only explanation.
Always add the reason and next action.
Set Targets Before You Judge Performance
A dashboard without targets becomes a scoreboard.
Set goals such as:
Traffic target
6,000 qualified sessions/month
Lead target
200/month
Qualified lead target
50/month
Customer target
10/month
CAC target
Below ₹15,000
Revenue target
₹6 lakh/month
Then compare:
rather than simply:
Don't Use the Same Target Forever
Targets should evolve.
If you consistently generate:
200 leads/month
then setting:
200 leads
as your permanent target doesn't encourage improvement.
At the same time, don't increase targets simply to make the team look underperforming.
Targets should reflect:
- Business capacity
- Sales capacity
- Budget
- Market opportunity
- Historical performance
- Profitability
Segment the Dashboard
One overall social media number can hide important differences.
Break results down by:
- Platform
- Campaign
- Content format
- Content theme
- Audience
- Funnel stage
- Organic vs paid
- Product/service
For example:
Instagram may generate most engagement.
LinkedIn may generate fewer interactions but higher-value B2B leads.
YouTube may generate fewer leads but stronger assisted conversions.
The best platform is not necessarily the one with the largest audience.
It's the one that performs well against the business objective.
Compare Content by Business Outcome
Create a ranking table.
| Content | Reach | Leads | Qualified | Customers | Revenue |
|---|---|---|---|---|---|
| Topic A | 80K | 30 | 8 | 1 | ₹40K |
| Topic B | 25K | 20 | 10 | 3 | ₹1.5L |
| Topic C | 100K | 12 | 2 | 0 | ₹0 |
| Topic D | 18K | 15 | 9 | 2 | ₹90K |
Which content deserves more attention?
Probably B and D—not necessarily C.
This is the difference between:
and
content business value.
Build a Monthly Content Efficiency Report
At the end of each month, identify:
Top reach content
What attracted the largest relevant audience?
Top engagement content
What generated the strongest response?
Top traffic content
What drove people to the website?
Top lead content
What generated enquiries?
Top qualified-lead content
What attracted the right audience?
Top revenue content
What contributed to customers or revenue?
Now your next content calendar can be based on evidence.
What to Do When Metrics Conflict
This happens frequently.
Reach ↑
but
Leads ↓
Don't celebrate immediately.
Investigate the content-to-conversion journey.
Leads ↑
but
Qualified leads ↓
Investigate targeting and messaging.
Qualified leads ↑
but
Customers ↓
Investigate sales follow-up.
Customers ↑
but
Revenue ↓
Investigate deal value and customer mix.
Revenue ↑
but
ROI ↓
Investigate rising acquisition costs.
The dashboard should help you locate the bottleneck.
Create a Funnel Health Score
You can create an internal health score from several indicators.
For example:
- Traffic performance
- Lead conversion
- Lead quality
- Sales conversion
- Revenue efficiency
Each can be scored from 1–5.
Example:
| Area | Score |
|---|---|
| Reach quality | 4/5 |
| Traffic | 4/5 |
| Lead generation | 3/5 |
| Lead quality | 4/5 |
| Sales conversion | 2/5 |
| Revenue efficiency | 3/5 |
The conclusion isn't:
“Social media is performing badly.”
It may be:
“Marketing is generating enough qualified demand, but sales conversion is the current bottleneck.”
That's a much more useful conclusion.
The Dashboard Should Create Decisions
Every monthly report should end with something like:
Continue
Case-study content.
Reduce
Generic promotional posts.
Test
New hooks for lead-generation Reels.
Fix
Landing-page conversion rate.
Scale
High-quality retargeting audiences.
Investigate
Drop in lead-to-sale conversion.
This is where analytics becomes strategy.
30-Day Social Media Dashboard Implementation
Week 1 — Define KPIs
Document:
- Business goals
- Primary KPIs
- Supporting KPIs
- Lead definition
- Qualified lead definition
- Revenue definition
Week 2 — Connect Data
Bring together:
- Social platform data
- Website analytics
- Lead forms
- CRM
- Advertising platforms
- Sales outcomes
Week 3 — Build Dashboard
Create:
- Executive summary
- Content performance
- Traffic
- Lead funnel
- Paid performance
- Revenue
- Insights
Week 4 — Establish Reporting Rhythm
Weekly
Check:
- Major performance changes
- Campaign problems
- Lead volume
- Paid efficiency
Monthly
Review:
- Content patterns
- Funnel conversion
- Lead quality
- Customers
- Revenue
Quarterly
Review:
- Channel strategy
- Budget allocation
- Audience quality
- Business ROI
Social Media ROI Dashboard Checklist
Strategy
- Business goal is defined
- Primary KPI is defined
- Targets are documented
Visibility
- Reach
- Impressions
- Relevant audience growth
Engagement
- Saves
- Shares
- Comments
- Watch time
Traffic
- Link clicks
- Website sessions
- Landing-page performance
Leads
- Leads
- Qualified leads
- CPL
- Cost per qualified lead
Sales
- Opportunities
- Customers
- Conversion rates
- CAC
Revenue
- Revenue
- Revenue per lead
- ROAS
- ROI
Decision-making
- What worked?
- What failed?
- Why?
- What changes next month?
Common Dashboard Mistakes
Mistake 1: Putting followers at the top
Fix: Put business outcomes first.
Mistake 2: Tracking everything
Fix: Keep the executive dashboard focused and create detailed supporting views.
Mistake 3: Mixing organic and paid without labels
Fix: Separate them while showing their combined business contribution where useful.
Mistake 4: Measuring leads without qualification
Fix: Track qualified leads.
Mistake 5: Measuring revenue without explaining attribution
Fix: Clearly document the attribution method.
Mistake 6: Comparing unrelated content
Fix: Compare content against its objective.
Mistake 7: Reporting without recommendations
Fix: End every reporting cycle with decisions and actions.
The Ideal Social Media ROI Dashboard
At the highest level, your dashboard should look like this:
That's the entire system.
Not 50 disconnected numbers.
One connected business journey.
SEO Publishing Information
Blog ID: SMM-20 Category: Social Media Marketing Stage: Improve Primary Keyword: social media ROI dashboard Supporting Keywords: social media KPIs dashboard; social media reporting; engagement vs revenue metrics Search Intent: Informational Funnel Stage: Solution Aware Pillar Page: Social Media Marketing Services Suggested URL: `/blog/social-media-marketing/social-media-roi-dashboard-the-metrics-that-matter` Content Role: Optimization / measurement resource Publishing Sprint: Sprint 4 CTA: Get a social media growth strategy / Explore Social Media Marketing
Meta Title: Social Media ROI Dashboard: The Metrics That Matter | Sampurn Digital
Meta Description: Learn how to build a social media ROI dashboard that tracks reach, engagement, traffic, leads, qualified leads, customers, revenue and ROI.
H1: Social Media ROI Dashboard: The Metrics That Matter