
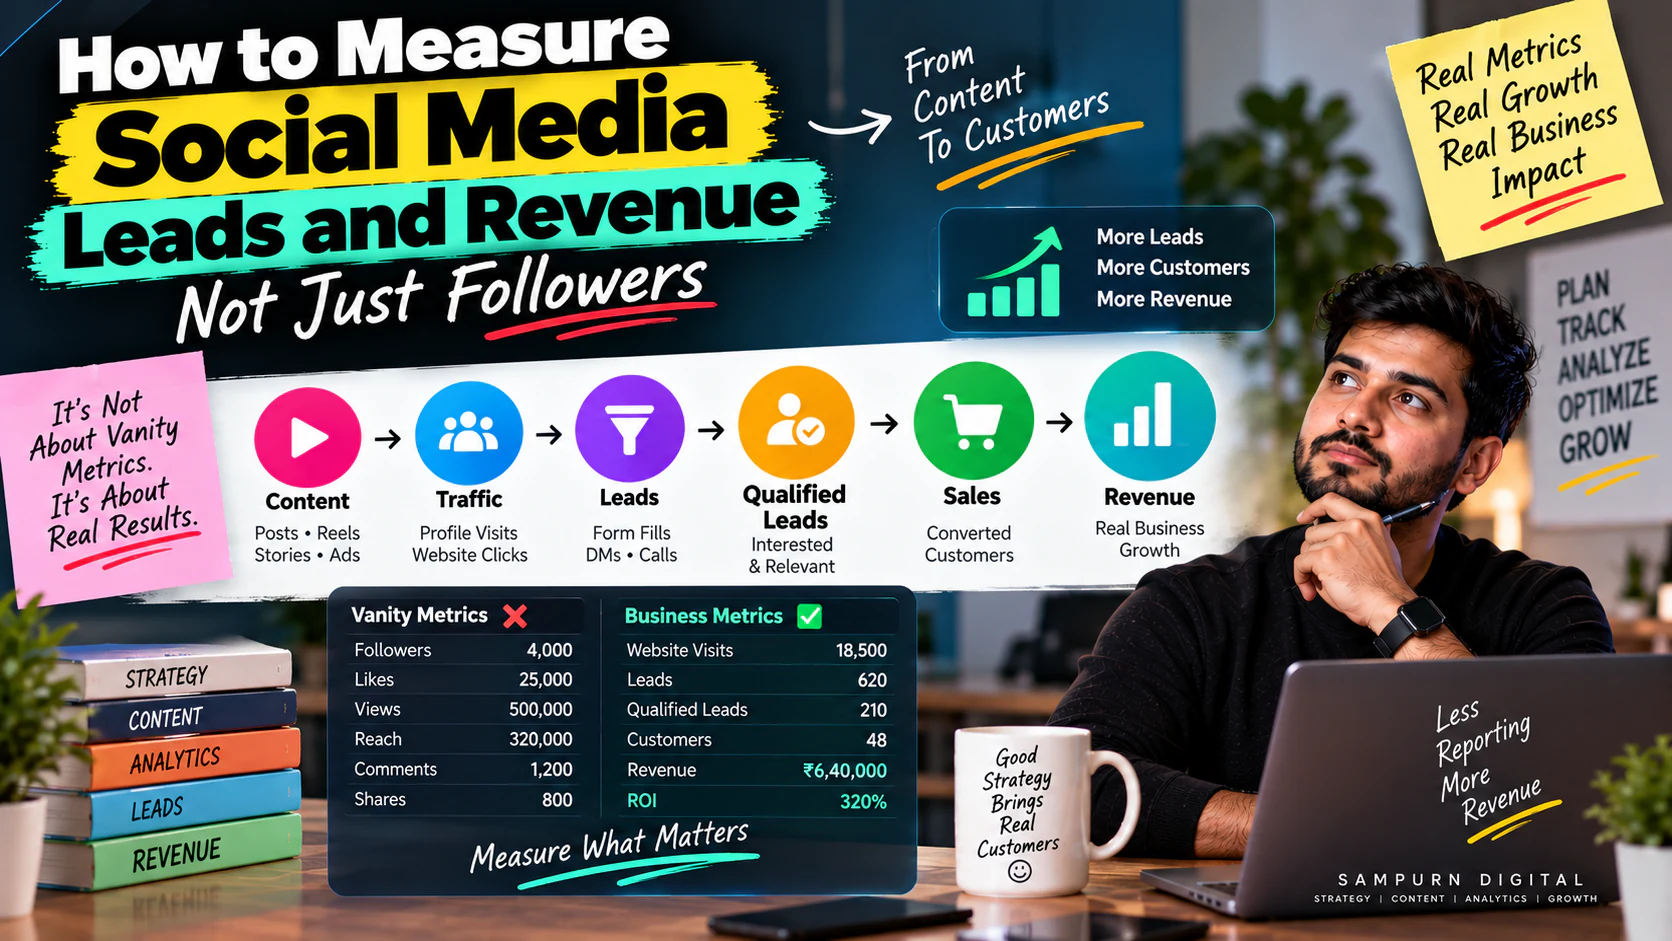
Your Instagram account gained 4,000 followers this month.
Your Reels generated 500,000 views.
Engagement increased by 38%.
Everyone on the team is excited.
Then the business owner asks:
Silence.
This is one of the biggest problems with social media reporting.
Businesses often measure what platforms make easy to count:
- Followers
- Likes
- Views
- Reach
- Comments
- Shares
Those numbers can be useful.
But they don't automatically tell you whether social media is helping the business grow.
A business needs to connect:
That is the real measurement chain.
This guide explains how to measure social media leads and revenue in a way that helps you make better marketing decisions—not just produce impressive monthly reports.
Why Followers Are a Weak Business KPI
Suppose two businesses have very different results.
Business A
Followers: 50,000 Monthly enquiries: 12 Customers: 2
Business B
Followers: 8,000 Monthly enquiries: 85 Customers: 17
Which business has better social media performance?
If your goal is revenue, probably Business B.
This is why follower growth should usually be treated as a supporting metric, not the final business KPI.
The question isn't:
“How many people follow us?”
It is:
“What happened after people discovered us?”
The Social Media Revenue Funnel
A useful measurement model is:
Each stage answers a different question.
Reach
Are we getting attention?
Engagement
Does the content resonate?
Traffic
Are people interested enough to explore?
Leads
Are people taking a business action?
Qualified leads
Are the right people taking action?
Sales
Can the business convert them?
Revenue
Did social activity contribute to actual business growth?
This is the funnel your reporting should reflect.
Start With the Business Goal
Before choosing metrics, define what social media is supposed to accomplish.
For example:
Goal 1 — Brand awareness
Track:
- Relevant reach
- Video consumption
- Branded searches where measurable
- Audience growth
Goal 2 — Website traffic
Track:
- Link clicks
- Sessions
- Engaged sessions
- Landing-page behavior
Goal 3 — Lead generation
Track:
- Leads
- Cost per lead
- Qualified leads
- Cost per qualified lead
Goal 4 — Sales
Track:
- Opportunities
- Customers
- Revenue
- Customer acquisition cost
A business cannot meaningfully evaluate social media without defining what success means first.
Build a Social Media KPI Hierarchy
Not every metric deserves equal importance.
A useful hierarchy is:
Level 1 — Business Outcomes
- Revenue
- Customers
- Sales opportunities
- Qualified leads
Level 2 — Conversion Metrics
- Leads
- Lead-to-opportunity rate
- Opportunity-to-customer rate
- Conversion rate
- Cost per acquisition
Level 3 — Traffic Metrics
- Website visits
- Landing-page sessions
- Link clicks
- Profile visits
Level 4 — Engagement Metrics
- Saves
- Shares
- Comments
- Video watch time
Level 5 — Visibility Metrics
- Reach
- Impressions
- Follower growth
- Views
The further down the hierarchy you go, the further you are from direct business impact.
That doesn't mean lower-level metrics are useless.
It means they need to be interpreted in context.
The Most Important Shift: Measure Leads
For many service businesses, the first major step beyond engagement is measuring leads.
A lead might be:
- Contact-form submission
- WhatsApp enquiry
- Phone call
- Consultation request
- Demo request
- Quote request
- Direct message
- Booking
The exact definition should match your business.
Don't count every social interaction as a lead.
A comment saying:
“Nice post\!”
is engagement.
A person saying:
“Can you send me your pricing?”
is much closer to a commercial lead.
Define a Lead Before Measuring It
Create a simple lead definition.
For example:
Then define your lead sources.
| Lead Source | Lead? |
|---|---|
| Instagram comment | Usually no |
| Reel view | No |
| Profile visit | No |
| Website form | Yes |
| WhatsApp enquiry | Yes |
| Consultation booking | Yes |
| Product purchase | Customer |
| Newsletter signup | Depends on business model |
This prevents inflated reporting.
Then Measure Qualified Leads
Not every lead deserves the same value.
Suppose social media generates:
But only:
Your sales team doesn't have 100 real opportunities.
They have approximately 15 meaningful prospects.
So track:
Example:
15 qualified leads ÷ 100 leads × 100
\= 15% qualified lead rate
This number tells you something that total lead volume cannot.
Cost Per Lead Is Not Enough
Suppose you spend:
and generate:
Your CPL is:
That sounds excellent.
But suppose only 10 leads are qualified.
Then:
Now compare that with another campaign:
Spend: ₹50,000 Leads: 100 Qualified leads: 25
CPL:
Cost per qualified lead:
The second campaign generates fewer leads.
But potentially much better business value.
Measure Lead-to-Sale Conversion
Now take the funnel one step further.
Suppose social media generated:
Then:
And:
These numbers tell you whether your lead generation is producing people who can actually become customers.
Measure Revenue From Social Leads
This is where reporting becomes much more valuable.
Suppose:
Social-generated customers \= 8
Average revenue per customer \= ₹40,000
Then:
But be careful.
Revenue attribution can be more complicated than simply assigning the entire sale to the last social interaction.
Someone might:
- Discover you on Instagram
- Search your brand on Google
- Read your website
- Return through direct traffic
- Speak to sales
- Become a customer
Which channel gets credit?
That's an attribution question.
For a deeper understanding, connect this measurement system with Marketing Attribution: How to Know Which Channel Generated the Customer.
Social Media Attribution: Don't Oversimplify It
There are several ways businesses may assign credit.
First-touch attribution
The first known interaction receives credit.
Example:
Instagram introduced the customer.
Last-touch attribution
The interaction immediately before conversion receives credit.
Example:
The customer clicked a social link before submitting the form.
Multi-touch attribution
Credit is distributed across multiple interactions.
Example:
Instagram → Google → Website → Email → Sale
Multiple channels contributed.
No attribution model perfectly explains every customer journey.
The important thing is to choose a consistent model and understand its limitations.
For paid social campaigns, this becomes especially important when evaluating the complete conversion journey.
Use UTMs for Website Traffic
If your social content sends people to your website, use campaign tracking parameters.
A basic structure can distinguish:
- Source
- Medium
- Campaign
- Content
For example, conceptually:
Source: Instagram
Medium: social
Campaign: lead-generation-guide
Content: reel-a
Now your analytics system can identify where the traffic came from.
This becomes particularly useful when you have multiple campaigns and creatives.
Track Different Content Types Separately
Don't report all social media content as one giant number.
Separate:
- Reels
- Carousels
- Stories
- Static posts
- Promotional posts
- Educational posts
- Founder-led content
- Case studies
Then ask:
You may discover:
Reels
High reach.
Carousels
High saves.
Case studies
Low reach but high enquiries.
Stories
High conversion rate.
That changes how you should allocate your content effort.
Measure Content by Its Job
A useful framework is:
| Content Type | Primary KPI |
|---|---|
| Awareness Reel | Relevant reach |
| Educational Reel | Watch time + saves |
| Carousel | Saves + shares |
| Case study | Profile visits + enquiries |
| Offer post | Leads |
| Story CTA | Clicks + conversions |
| Testimonial | Conversion rate |
| Retargeting creative | Leads/sales |
This prevents you from judging every post using the same metric.
A case study doesn't need to beat an entertainment Reel on views.
It needs to help move prospects toward conversion.
Build a Content-to-Revenue Model
Imagine your monthly data looks like this:
| Metric | Result |
|---|---|
| Reach | 250,000 |
| Website visits | 5,000 |
| Leads | 180 |
| Qualified leads | 54 |
| Opportunities | 24 |
| Customers | 8 |
| Revenue | ₹4,80,000 |
Now you can calculate funnel ratios.
Visitor-to-lead rate
180 ÷ 5,000 × 100
\= 3.6%
Lead-to-qualified rate
54 ÷ 180 × 100
\= 30%
Qualified-to-customer rate
8 ÷ 54 × 100
≈ 14.8%
This is much more actionable than:
“We got 250,000 reach.”
Calculate Social Media Customer Acquisition Cost
If you have a measurable social acquisition spend, calculate:
Suppose:
Social advertising + production + management cost \= ₹1,20,000
Customers acquired \= 8
Then:
Now compare that with customer value.
If each customer generates only ₹10,000, the economics are concerning.
If the average customer generates ₹75,000, the picture is very different.
Measure Revenue Per Lead
Another useful metric:
Suppose:
Revenue \= ₹4,80,000
Leads \= 180
Then:
This can help you compare lead-generation systems.
But remember that revenue may occur weeks or months after the initial lead.
Your reporting window should account for the sales cycle.
Measure Revenue Per Qualified Lead
For higher-ticket businesses, this can be even more useful.
Suppose:
Revenue \= ₹4,80,000
Qualified leads \= 54
Then:
Now the business can compare:
against
That gets much closer to unit economics.
Don't Ignore the Sales Team
Marketing cannot accurately measure social media revenue without good CRM data.
The sales team should record:
- Lead source
- Campaign/source where available
- Qualification status
- Opportunity status
- Deal value
- Won/lost
- Revenue
- Lost reason
Otherwise marketing may report:
“Social generated 100 leads.”
while sales says:
“Only 12 were real opportunities.”
Both teams are looking at different parts of the same funnel.
Create a Single Lead Source Taxonomy
Keep naming consistent.
For example:
Source
Medium
Organic Social
Campaign
Lead Generation Campaign
Content
Reel 03
Now compare that with:
Source
Medium
Paid Social
Campaign
Retargeting
Content
Case Study 02
This gives your reporting system more useful detail.
Organic Social vs Paid Social Measurement
Do not automatically evaluate both using identical KPIs.
Organic social
You may focus more on:
- Reach
- Saves
- Shares
- Profile visits
- Website clicks
- Assisted conversions
- Organic leads
Paid social
You may additionally track:
- Spend
- CPM
- CTR
- CPC
- CPL
- Qualified CPL
- CAC
- Revenue
- ROAS
The two systems work together but have different measurement mechanics.
For the broader strategic decision between them, connect this article with Organic Social vs Paid Social: What Should Your Business Invest In?
Measure Assisted Conversions Carefully
Sometimes social media does not create the final conversion.
But it may create the initial demand.
Example:
A customer:
Last-click reporting might give Google or direct traffic the credit.
But social still influenced discovery.
This is why businesses should avoid making decisions solely from one attribution report.
The Difference Between Attribution and Influence
This distinction matters.
Attribution
Who receives credit according to your selected measurement model?
Influence
Which channels or interactions contributed to the customer's journey?
Social media may have substantial influence even when its last-click revenue appears low.
That doesn't mean you should blindly claim every sale as a social conversion.
It means your reporting needs enough context to understand the journey.
Build a Monthly Social Revenue Report
A useful report can have six sections.
Visibility
- Reach
- Impressions
- Follower growth
Engagement
- Saves
- Shares
- Comments
- Video consumption
Traffic
- Profile visits
- Link clicks
- Website sessions
Leads
- Leads
- Qualified leads
- Cost per lead
- Cost per qualified lead
Sales
- Opportunities
- Customers
- Conversion rates
Revenue
- Attributed revenue
- Revenue per lead
- Customer acquisition cost
- ROAS where relevant
This gives leadership a complete picture.
A Better Social Media Dashboard
Your dashboard could look like:
| KPI | This Month | Last Month | Change | Business Meaning |
|---|---|---|---|---|
| Reach | 250K | 210K | +19% | More visibility |
| Website visits | 5K | 4.1K | +22% | More interest |
| Leads | 180 | 140 | +29% | More demand |
| Qualified leads | 54 | 35 | +54% | Better lead quality |
| Customers | 8 | 6 | +33% | More sales |
| Revenue | ₹4.8L | ₹3.4L | +41% | Business growth |
Now the report tells a story.
Not just a collection of platform metrics.
Find Where the Funnel Is Breaking
Measurement becomes valuable when it leads to diagnosis.
Suppose:
but
Your content may be getting attention without generating curiosity.
Suppose:
but
Your landing page or offer may be the bottleneck.
Suppose:
but
Your targeting or messaging may be attracting the wrong audience.
Suppose:
but
The sales process may need investigation.
Suppose:
but
Deal size, pricing or customer mix may have changed.
This is why business metrics should be connected.
Use a Funnel Diagnostic Table
| Problem | Possible Cause |
|---|---|
| High reach, low traffic | Weak CTA |
| High traffic, low leads | Landing-page problem |
| High leads, low qualification | Poor targeting |
| High qualified leads, low sales | Sales process |
| High sales, low revenue | Deal size / pricing |
| High engagement, low commercial action | Content-business mismatch |
This turns analytics into decisions.
Don't Optimize the Wrong Metric
Imagine your team has a goal to increase followers.
They publish entertaining content.
Followers increase 40%.
But leads decline.
The team technically achieved its KPI.
The business didn't achieve its goal.
This is why KPIs must connect to business objectives.
A marketing team should not be rewarded for increasing a number that has no relationship with the outcome the company actually needs.
Create Content-Level Revenue Attribution
If your tracking allows it, compare content themes.
For example:
| Content Theme | Leads | Qualified Leads | Customers |
|---|---|---|---|
| SEO tips | 60 | 12 | 2 |
| Google Ads mistakes | 40 | 18 | 4 |
| Website tips | 35 | 10 | 1 |
| Case studies | 25 | 10 | 3 |
| General tips | 20 | 4 | 0 |
Now you can see something important.
The content with the highest lead volume isn't necessarily the content producing the most customers.
Google Ads content generated fewer leads than SEO content but more customers.
That is a strategic insight.
Build a Content Efficiency Score
You can create an internal score to prioritize content.
For example:
Suppose:
Content A:
Reach \= 50,000 Qualified leads \= 10
Efficiency:
10 ÷ 50,000 × 1,000 \= 0.2 qualified leads per 1,000 reach
Content B:
Reach \= 15,000 Qualified leads \= 8
Efficiency:
8 ÷ 15,000 × 1,000 ≈ 0.53
Content B reaches fewer people but generates qualified leads more efficiently.
This isn't a universal industry benchmark.
It is an internal comparison tool.
Measure Social Media by Business Objective
Create a scorecard like this:
Awareness objective
Primary KPI: Relevant reach
Engagement objective
Primary KPI: Saves/shares
Traffic objective
Primary KPI: Qualified website sessions
Lead objective
Primary KPI: Qualified leads
Sales objective
Primary KPI: Customers/revenue
This prevents the common mistake of reporting:
“Everything is up\!”
when the business outcome is actually flat.
What Should You Report to Management?
Management usually doesn't need 50 social media metrics.
They need answers.
Question 1
How much attention did we generate?
Question 2
Did that attention create meaningful traffic?
Question 3
How many leads came from social?
Question 4
How many were qualified?
Question 5
How many became customers?
Question 6
How much revenue was generated or influenced?
Question 7
What should we change next month?
That's a useful social media report.
A Simple Monthly Reporting Template
Executive Summary
Social reach: 250K Website traffic: 5K Leads: 180 Qualified leads: 54 Customers: 8 Revenue: ₹4.8L
What improved?
Qualified leads increased.
What declined?
Organic traffic from promotional posts.
What worked?
Case studies and problem-focused content.
What should happen next?
Increase production around high-intent topics and improve conversion paths.
That is far more valuable than:
“We posted 20 times this month.”
30-Day Measurement Setup
Week 1 — Define
Document:
- Business objectives
- Lead definition
- Qualified lead definition
- Conversion events
- Revenue definition
Week 2 — Tracking
Set up:
- UTMs
- Analytics
- CRM source fields
- Form tracking
- Call/WhatsApp tracking where possible
- Campaign naming
Week 3 — Dashboard
Build:
- Visibility section
- Engagement section
- Traffic section
- Lead section
- Sales section
- Revenue section
Week 4 — Analysis
Review:
- Best content
- Best traffic sources
- Best lead sources
- Lead quality
- Conversion rates
- Revenue
- Funnel bottlenecks
Then create next month's content plan from the findings.
Social Media Measurement Checklist
Business
- Business goal is defined
- Primary KPI is defined
- Secondary KPIs are defined
Tracking
- Social links use campaign tracking
- Lead sources are captured
- CRM records source information
- Conversion events are measurable
Lead quality
- Lead definition exists
- Qualified lead definition exists
- Sales outcomes are recorded
- Lost reasons are captured
Revenue
- Customer value is tracked
- Revenue is connected to customers
- Attribution model is documented
- Assisted conversions are considered
Reporting
- Vanity metrics are separated from business KPIs
- Content performance is compared by objective
- Funnel drop-offs are identified
- Next actions are documented
Common Measurement Mistakes
Mistake 1: Reporting follower growth as success
Fix: Connect audience growth to traffic, leads or business outcomes.
Mistake 2: Treating views as leads
Fix: Define measurable conversion actions.
Mistake 3: Measuring only CPL
Fix: Track qualified leads and customers.
Mistake 4: Ignoring sales data
Fix: Connect marketing data with CRM outcomes.
Mistake 5: Giving every channel 100% attribution
Fix: Use a documented attribution model.
Mistake 6: Ignoring the sales cycle
Fix: Allow enough time for leads to become customers.
Mistake 7: Reporting numbers without decisions
Fix: Every report should answer:
The Social Media Measurement Framework
Use this simple model:
This final step is important.
Measurement should not be the end of the marketing process.
It should feed the next decision.
SEO Publishing Information
Blog ID: SMM-19 Category: Social Media Marketing Stage: Improve Primary Keyword: measure social media ROI and revenue Supporting Keywords: social media ROI metrics; track social media leads; revenue from social media Search Intent: Informational Funnel Stage: Solution Aware Pillar Page: Social Media Marketing Services Suggested URL: `/blog/social-media-marketing/how-to-measure-social-media-leads-and-revenue-not-just-followers` Content Role: Optimization / measurement resource Publishing Sprint: Sprint 4 CTA: Get a social media growth strategy / Explore Social Media Marketing
Meta Title: How to Measure Social Media Leads and Revenue, Not Just Followers | Sampurn Digital
Meta Description: Learn how to measure social media leads and revenue, not just followers, using practical ROI metrics, attribution, qualified leads, customers and revenue tracking.
H1: How to Measure Social Media Leads and Revenue, Not Just Followers