
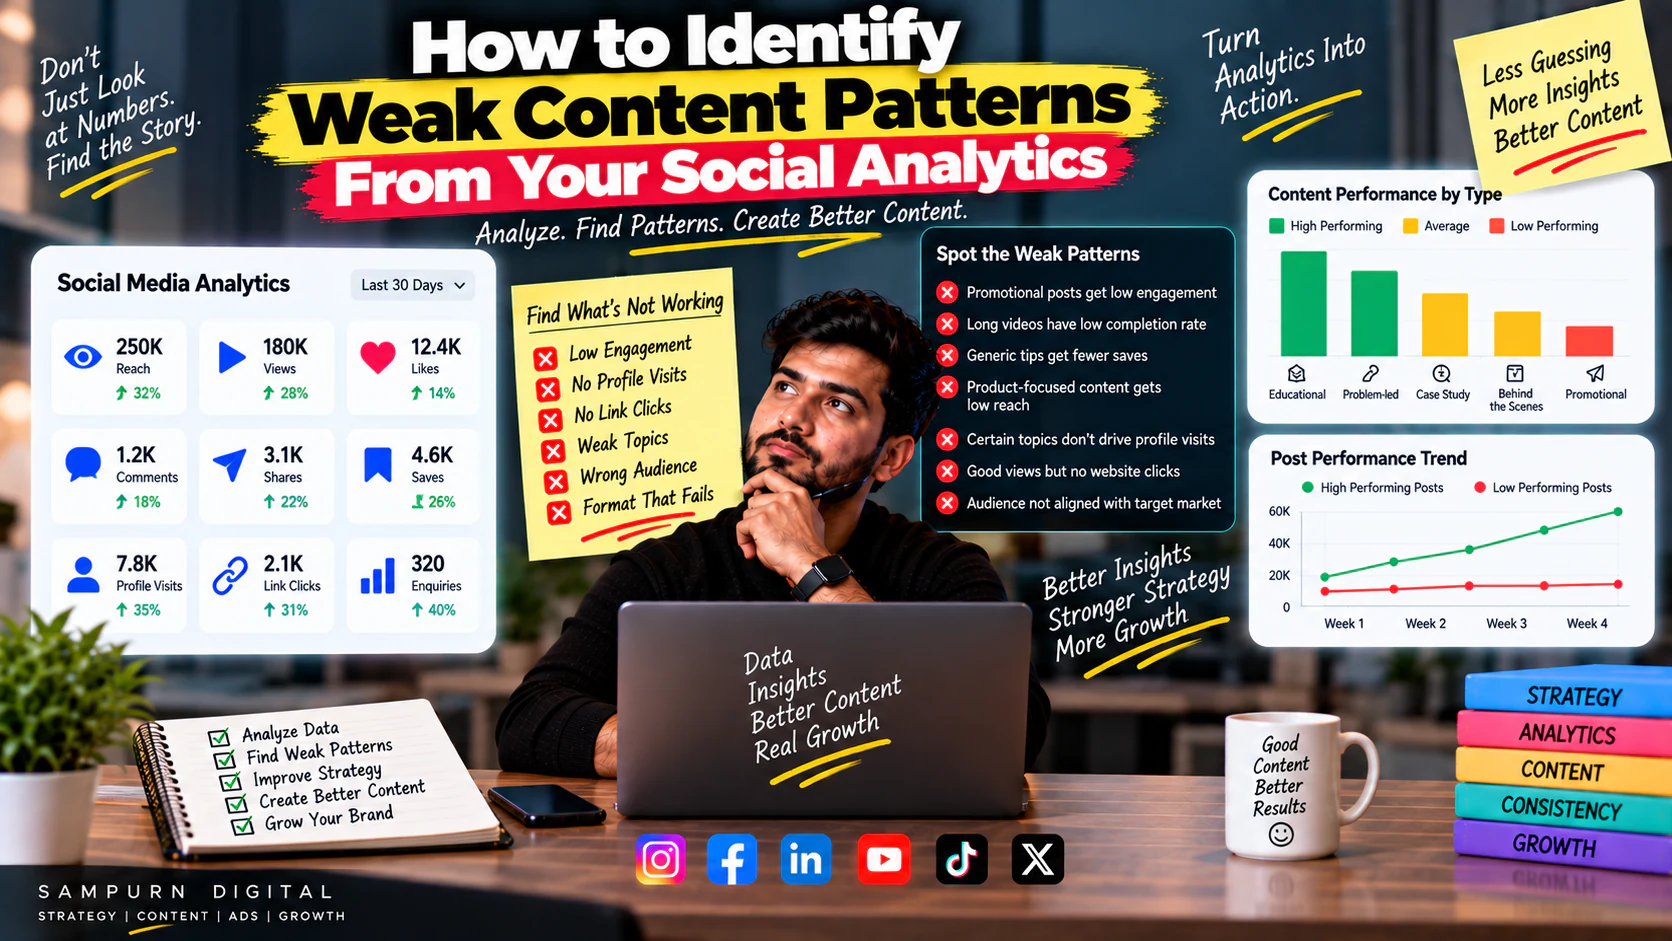
Your social media dashboard is full of numbers.
Reach.
Views.
Likes.
Comments.
Shares.
Saves.
Profile visits.
Link clicks.
But numbers alone don't tell you what to do next.
The real value of social analytics is not knowing that one Reel received 18,000 views.
It is understanding why it performed differently from the other 20 posts you published.
That's the difference between reporting and analysis.
Reporting says:
"This month we received 250,000 impressions."
Analysis says:
"Problem-led Reels generated substantially more profile visits than generic educational posts, while promotional posts produced the weakest engagement. We should test more problem-led content next month."
The second statement creates a decision.
That is what analytics should do.
This guide shows you how to identify weak content patterns from your social analytics, separate one-off failures from recurring problems, and turn the findings into better content decisions.
What Is a Weak Content Pattern?
A weak content pattern is a repeatable characteristic associated with poor content performance.
It might be:
- A topic that consistently gets low engagement
- A format that rarely generates meaningful actions
- A hook structure that loses attention
- Promotional content that gets ignored
- Long videos that consistently underperform
- Posts that get reach but no traffic
- Content that generates engagement from the wrong audience
The important word is pattern.
One bad post is not necessarily a pattern.
Ten similar posts producing similar weak results are much more interesting.
Why One Bad Post Doesn't Tell You Much
Imagine these three posts:
| Post | Reach | Engagement | Leads |
|---|---|---|---|
| A | 8,000 | 320 | 4 |
| B | 2,000 | 40 | 0 |
| C | 7,500 | 290 | 3 |
Post B looks like a failure.
But suppose Post B covered a highly technical topic intended for a small B2B audience.
Its lower reach may be acceptable.
Now imagine 10 posts like B all showing:
- Low reach
- Low engagement
- Low profile visits
- Low clicks
That's a pattern worth investigating.
The First Rule: Don't Start With Likes
Likes are easy to understand.
They're also easy to overvalue.
A business account should usually look at multiple layers:
Attention
- Reach
- Impressions
- Views
Engagement
- Comments
- Shares
- Saves
- Engagement rate
Interest
- Profile visits
- Follows
- Link clicks
- DMs
Conversion
- Leads
- Qualified leads
- Sales
- Revenue
The further down this funnel you can reliably measure, the more commercially useful your analysis becomes.
Build a Content Analysis Sheet
Before looking for patterns, collect your data.
A simple spreadsheet might contain:
| Date | Topic | Format | Hook | Reach | Views | Shares | Saves | Comments | Profile Visits | Clicks | Leads |
|---|---|---|---|---|---|---|---|---|---|---|---|
| 5 Sep | Topic A | Reel | Problem | 12K | 18K | 120 | 250 | 35 | 180 | 60 | 5 |
| 7 Sep | Topic B | Carousel | Question | 6K | — | 85 | 190 | 22 | 140 | 45 | 4 |
| 9 Sep | Topic C | Reel | Generic | 3K | 4K | 12 | 20 | 5 | 25 | 4 | 0 |
Then add useful classification columns:
- Content pillar
- Funnel stage
- Audience segment
- CTA
- Video length
- Creative type
- Promotion status
Now you can compare similar content instead of looking at isolated numbers.
Group Content by Topic
Start with the simplest analysis.
Take your last 30–50 posts.
Assign each one a topic.
For example:
| Topic | Posts | Average Reach | Avg. Saves | Avg. Leads |
|---|---|---|---|---|
| SEO mistakes | 6 | 8,400 | 180 | 4 |
| Ads strategy | 7 | 11,200 | 240 | 7 |
| Social media tips | 10 | 4,900 | 65 | 1 |
| Company updates | 5 | 2,800 | 15 | 0 |
| Case studies | 4 | 7,100 | 220 | 6 |
Now the pattern becomes visible.
Your company updates may not be "bad."
But if your goal is lead generation, they may deserve less production effort.
Compare Formats
Next, group content by format.
For example:
| Format | Posts | Avg. Reach | Avg. Saves | Avg. Clicks |
|---|---|---|---|---|
| Reels | 12 | 9,500 | 140 | 80 |
| Carousels | 10 | 7,200 | 260 | 120 |
| Static | 8 | 3,100 | 45 | 25 |
Don't immediately conclude:
"Carousels are better."
Ask:
If Reels produce reach and carousels produce saves and clicks, both may have a role.
Analyse Content by Funnel Stage
Separate your posts into:
Awareness
Designed to attract attention.
Consideration
Designed to educate and build preference.
Decision
Designed to move people toward an enquiry or purchase.
Now compare performance.
You might discover:
- Awareness content → high reach
- Consideration content → high saves
- Decision content → lower reach but more leads
That is not necessarily a problem.
Different content serves different jobs.
Identify Your Weakest Topics
Don't simply sort by lowest reach.
Instead, ask:
Which topics repeatedly underperform?
For example:
8 posts Average reach: 3,000 Average saves: 20 Average clicks: 4
8 posts Average reach: 9,000 Average saves: 180 Average clicks: 70
If Topic A repeatedly performs poorly, investigate why.
Potential causes:
- Wrong audience
- Weak topic
- Generic angle
- Poor format
- Weak hook
- Excessive promotion
- Low customer relevance
Look for "High Reach, Low Value" Content
This is one of the most important patterns.
A post can perform well on attention metrics while producing little business value.
Example:
50,000 reach 2,000 likes 300 shares 5 website clicks 0 leads
8,000 reach 450 likes 110 saves 90 clicks 7 leads
If your objective is lead generation, Post B deserves serious attention.
This doesn't mean Post A is useless.
It means reach should not be your only decision-making metric.
Look for "Low Reach, High Value" Content
The opposite pattern matters too.
Imagine a highly specialised B2B post gets:
but generates:
- 18 profile visits
- 9 website clicks
- 4 qualified enquiries
- 1 customer
You should not automatically classify that post as a failure.
Its audience may simply be smaller and more commercially relevant.
This is why content analysis needs both:
Shares and saves can reveal a different type of content value.
High shares
May indicate:
- Relatability
- Strong opinion
- Useful insight
- Entertainment
- Identity
- Community relevance
High saves
May indicate:
- Reference value
- Educational value
- Practical usefulness
- Checklist value
- Step-by-step value
If your educational posts consistently receive saves, you may have found a strong content format.
Analyse Comments for Qualitative Signals
Analytics aren't only numerical.
Read the comments.
Look for:
- Questions
- Objections
- Confusion
- Agreement
- Customer stories
- Requests for more information
- Repeated terminology
For example, if several people comment:
"Can you explain how this works for a small business?"
you've found your next content topic.
The audience is literally telling you what they need.
Analyse DMs
DMs can reveal patterns that dashboard metrics cannot.
Create categories:
| DM Type | Count |
|---|---|
| Product questions | 18 |
| Pricing | 11 |
| How-to questions | 24 |
| Service enquiries | 7 |
| Support | 12 |
| Spam | 35 |
Now look at which content preceded meaningful conversations.
A post may have average public engagement but generate unusually strong private conversations.
That's important.
Analyse Your Hooks
Don't analyse content only by topic.
Analyse the opening.
Create categories such as:
- Problem
- Question
- Mistake
- Contrarian
- Statistic
- Curiosity
- Tutorial
- Story
- Direct promise
Then compare them.
Example:
| Hook Type | Posts | Avg. Reach | Avg. Saves |
|---|---|---|---|
| Problem | 8 | 11K | 210 |
| Question | 6 | 7K | 140 |
| Generic | 9 | 3.8K | 55 |
| Tutorial | 7 | 9K | 260 |
Now you have something you can test.
Analyse Creative Types
You can also classify visual treatments.
Examples:
- Talking head
- Screen recording
- Product demo
- Graphic
- Carousel
- Customer story
- Before/after
- Behind-the-scenes
You may find that one creative type consistently produces stronger results for a particular topic.
That's useful information for your content planning.
Analyse Video Length
For video content, create groups.
For example:
- Under 15 seconds
- 15–30 seconds
- 30–60 seconds
- 60+ seconds
Then compare them against the appropriate metrics.
Don't assume shorter is always better.
A 45-second tutorial may be more valuable than a 12-second clip if the audience actually needs the explanation.
The goal is to discover your audience's response patterns, not copy arbitrary rules.
Compare CTAs
Your CTA can influence the next action.
Group your posts by CTA:
- Follow
- Comment
- Save
- Share
- Visit website
- Send DM
- Book consultation
- Shop now
Then compare outcomes.
You may discover that:
"Visit website"
produces few clicks on cold educational content, while:
"Save this checklist"
produces significantly stronger engagement.
That doesn't mean website CTAs are bad.
It means the CTA may need to match the audience's intent.
Identify Content With High Engagement but Low Conversion
This is a common business problem.
Your audience loves the content.
But nobody takes the next step.
For example:
10,000 reach 500 engagements 8 website clicks 0 leads
Possible causes:
- Weak CTA
- Wrong audience
- Weak offer
- Poor profile positioning
- Poor landing page
- Content attracts curiosity rather than buying intent
Don't automatically create more engagement content.
Investigate the transition from attention to action.
Identify Content With Low Engagement but High Conversion
This pattern can be even more interesting.
Example:
4,000 reach 80 engagements 35 clicks 6 qualified leads
This content may not be socially impressive.
But it may be commercially strong.
Keep it in your strategy.
The objective is not to make every post a viral post.
Compare New Content With Your Historical Baseline
Don't compare every post with your single best-performing post.
That's a terrible baseline.
If your normal Reel gets:
and one gets:
that's meaningful improvement.
If your best-ever Reel received:
using that as your standard will make everything look terrible.
Use:
- Median performance
- Average performance
- Recent 10-post performance
- Format-specific baseline
- Topic-specific baseline
This creates a much more realistic picture.
Average vs Median: Why It Matters
Suppose your five Reels generated:
Average:
Median:
If you use the average, your normal Reel appears to be performing at 22.8K.
It isn't.
The 100K Reel is an outlier.
For many social datasets, the median can provide a more useful view of typical performance.
Find Your "Repeatable Winners"
The best content isn't always the post with the biggest number.
Look for content that repeatedly performs well.
For example:
- Problem-led Reels
- Case-study carousels
- Comparison posts
- Practical checklists
- Customer FAQs
If several posts using the same underlying approach work, you've found a potentially repeatable pattern.
Find Your "Repeatable Losers"
Now look for patterns that repeatedly fail.
For example:
Pattern
Generic motivational graphics.
Evidence
8 posts.
Results
Consistently low:
- Reach
- Saves
- Shares
- Clicks
Decision
Reduce or redesign this content category.
This is much better than saying:
"The algorithm doesn't like our posts."
Don't Confuse Topic Failure With Format Failure
Suppose a Reel about accounting software performs poorly.
Before abandoning the topic, test it as:
- Carousel
- Case study
- FAQ
- Customer story
- Tutorial
Maybe the topic is useful.
The format was wrong.
Similarly, a great Reel topic may perform poorly as a static graphic.
Always separate:
Don't Confuse Format Failure With Creative Failure
Suppose your carousels consistently underperform.
That doesn't automatically mean:
"Carousels don't work for us."
Maybe your first slides are weak.
Maybe the text is too dense.
Maybe the design is difficult to read.
Maybe the topic is too generic.
Diagnose the creative before killing the format.
Create a Weak Pattern Score
You can build a simple internal scoring system.
Score each content pattern from 1–5:
| Factor | Score |
|---|---|
| Reach | 2 |
| Engagement | 2 |
| Saves/Shares | 1 |
| Traffic | 1 |
| Leads | 1 |
| Audience relevance | 2 |
| Total | 9/30 |
The score isn't an industry benchmark.
It's a prioritisation tool.
Separate "Stop" From "Improve"
Not every weak pattern should be eliminated.
Use three categories:
Scale
Repeatedly strong.
Create more variations.
Improve
Promising but inconsistent.
Change one or two variables.
Stop
Repeatedly weak with little strategic value.
Reduce production.
Example:
| Content Pattern | Decision |
|---|---|
| Problem-led educational Reels | Scale |
| Case-study carousels | Scale |
| Generic motivational quotes | Stop |
| Service promotions | Improve |
| Customer FAQs | Scale |
Turn Analytics Into a Content Hypothesis
Don't write:
"Reels performed better."
Write:
"Problem-led Reels between 20–40 seconds generated stronger profile visits than generic educational Reels. We will test five additional problem-led variations."
That's a hypothesis.
It can be tested.
Use the 3-Part Content Learning Loop
Every month:
What worked?
Identify winners.
Why might it have worked?
Identify:
- Topic
- Hook
- Format
- Audience
- CTA
- Timing
- Creative
What should we test next?
Create variations.
This turns social media into an iterative system rather than a content calendar that resets every month.
A Practical Social Analytics Dashboard
Your reporting sheet can include:
| Category | Metrics |
|---|---|
| Reach | Reach, impressions |
| Attention | Views, watch behaviour |
| Engagement | Comments, shares, saves |
| Interest | Profile visits, follows |
| Traffic | Clicks, sessions |
| Conversion | Leads, qualified leads |
| Commercial | Sales, revenue |
Then add:
Now you can actually analyse relationships between content decisions and outcomes.
Example: Finding a Weak Pattern
Imagine a business reviews 40 posts.
They discover:
Reels
- Average reach: 12K
- Average leads: 1.5
Carousels
- Average reach: 7K
- Average leads: 3.2
Static graphics
- Average reach: 3K
- Average leads: 0.4
The first conclusion might be:
"Reels are the best."
But that's incomplete.
Reels are best for reach.
Carousels may be better for generating leads.
Therefore the strategy might become:
That's a much more useful content system.
A Better Way to Analyse Your Last 30 Posts
Use this five-step process.
Step 1
Export or record the performance of your last 30 posts.
Step 2
Tag each post by:
- Topic
- Format
- Hook
- Funnel stage
- CTA
Step 3
Compare performance by category.
Step 4
Identify repeated winners and losers.
Step 5
Create 3–5 content hypotheses for your next month.
Don't create the next calendar first.
The 5 Questions to Ask About Every Weak Post
When a post underperforms, ask:
Was the audience right?
If not, the content may have attracted the wrong people.
Was the topic relevant?
If not, creative optimisation won't save it.
Was the hook strong?
If not, people may never reach the valuable part.
Was the format appropriate?
If not, the idea may need to be repackaged.
Was the next action clear?
If not, attention may never become business value.
The 5 Questions to Ask About Every Winning Post
Do the reverse.
What problem did it address?
What made the opening compelling?
Which format was used?
What audience responded?
What action happened afterward?
Then create variations.
Don't simply repost the same content.
Replicate the underlying reason it worked.
How Often Should You Analyse Social Content?
A practical rhythm is:
Weekly
Check:
- Obvious winners
- Obvious failures
- Comments
- DMs
- Operational issues
Monthly
Analyse:
- Topics
- Formats
- Hooks
- CTAs
- Funnel stages
- Traffic
- Leads
Quarterly
Review:
- Platform strategy
- Audience
- Content pillars
- Business contribution
- Resource allocation
This keeps analysis proportional to the speed at which your content changes.
What Not to Do With Social Analytics
Don't chase the biggest number
100K views aren't automatically better than 10K relevant views.
Don't change your strategy after one post
Look for repeated evidence.
Don't compare different objectives blindly
A brand-awareness post and a lead-generation post shouldn't necessarily have identical KPIs.
Don't ignore qualitative feedback
Comments and DMs contain customer language.
Don't report without decisions
A dashboard that produces no action is just a scoreboard.
Turn Your Analytics Into Next Month's Content Plan
Suppose your analysis shows:
Winner
Problem-led carousel
Winner
Short educational Reel
Weak
Generic service promotion
Weak
Motivational graphic
Your next month could therefore become:
The exact mix should depend on your business.
The important part is that the calendar comes from evidence.
From Analytics to a Repeatable Content System
Once you identify strong patterns, document them.
For example:
Winning topic
Customer pain point
Winning hook
Specific problem
Winning format
Carousel
Winning CTA
Save / visit guide
Winning audience
Solution-aware prospects
Now you have a repeatable content recipe.
Create 10 variations.
Then test again.
This is how social media moves from:
to:
What Comes Next?
Analytics should not end with a report.
It should lead to action.
If your analysis shows that certain content consistently performs well, the next step is to build a content strategy around those insights.
That can include:
- A monthly content calendar
- Stronger content pillars
- Better hooks
- More systematic testing
- Repeatable production
- Cross-platform repurposing
- Paid amplification
- Website conversion paths
For example, social analytics can tell you what people respond to.
A structured content calendar can turn those insights into consistent publishing.
A repeatable production workflow can then turn that strategy into an efficient operating process.
And strong-performing social content can also become useful material for broader SEO and content initiatives.
SEO Publishing Information
| Field | Details |
|---|---|
| Blog ID | SMM-08 |
| Category | Social Media Marketing |
| Stage | Diagnose |
| Primary Keyword | social media analytics content audit |
| Supporting Keywords | social analytics content analysis; identify low performing content; content performance insights |
| Search Intent | Informational |
| Funnel Stage | Solution Aware |
| Pillar Page | Social Media Marketing Services |
| Suggested URL | `/blog/how-to-identify-weak-content-patterns-from-your-social-analytics` |
| Content Role | Diagnostic / problem-solving resource |
| Publishing Sprint | Sprint 4 |
| Primary CTA | Get a social media growth strategy |
| Secondary CTA | Explore Social Media Marketing |
| Meta Title | How to Identify Weak Content Patterns From Social Analytics |
| Meta Description | Learn how to analyse social media analytics, identify weak content patterns, compare topics and formats, and turn performance data into better content decisions. |
| H1 | How to Identify Weak Content Patterns From Your Social Analytics |