
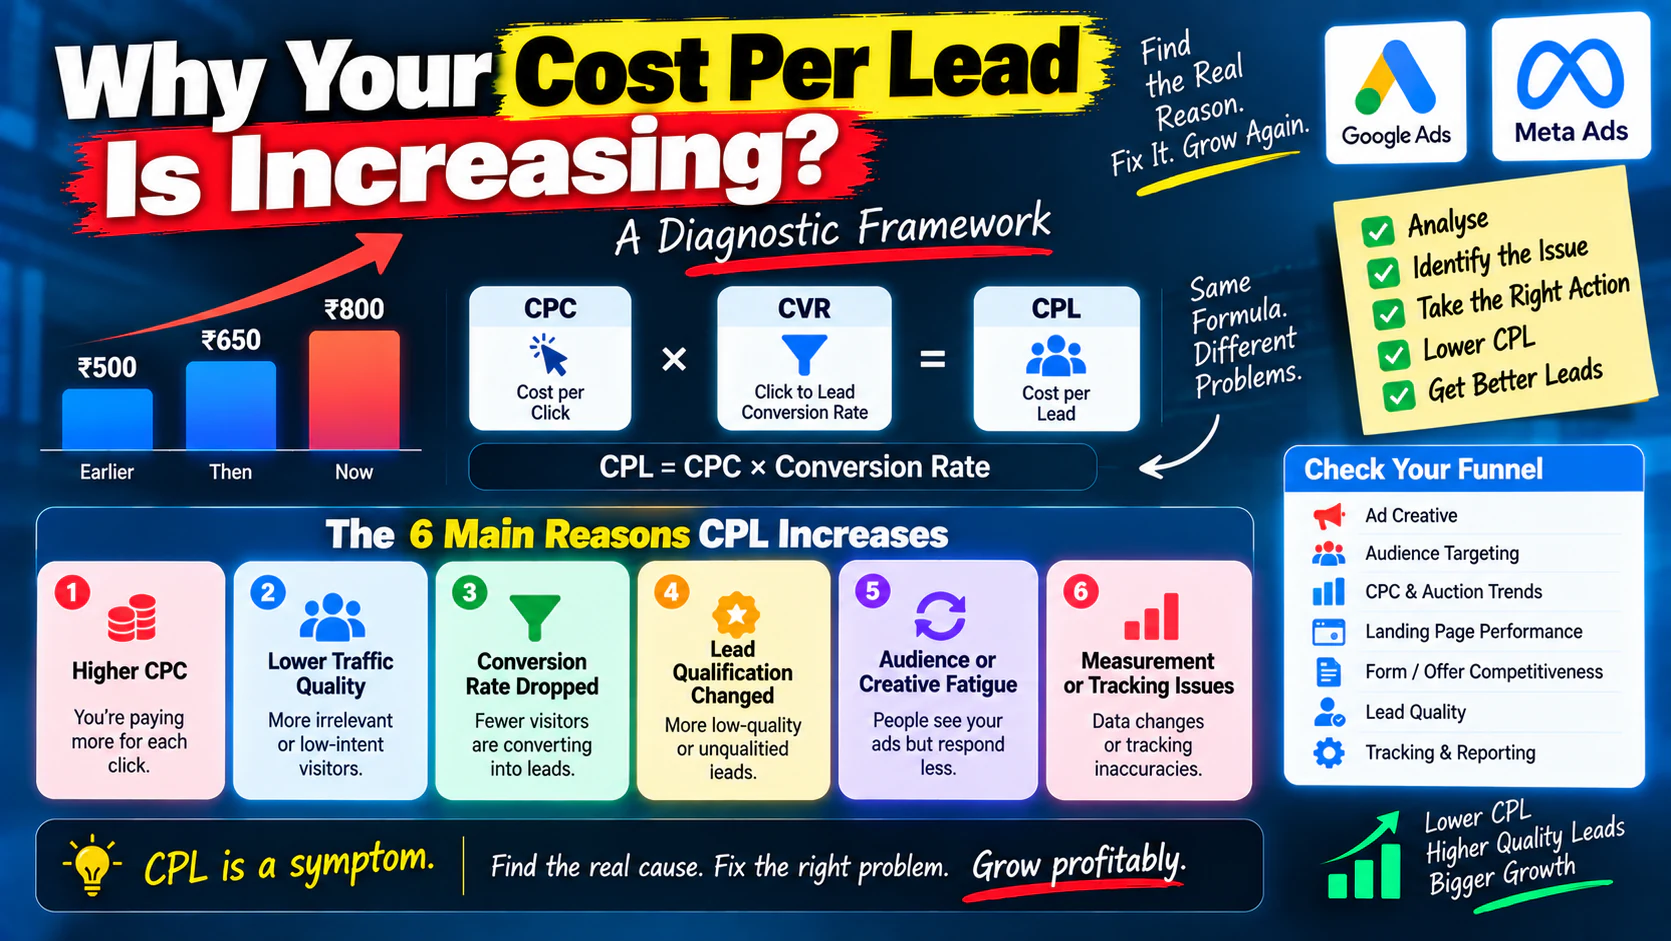
Your cost per lead was ₹500.
Then it became ₹650.
Then ₹800.
The first reaction is usually predictable:
So the bids get changed.
Budgets get adjusted.
Audiences are edited.
New creatives are launched.
And sometimes the CPL gets even worse.
The problem is that an increasing cost per lead is not a diagnosis. It is a symptom.
Your CPL can increase because of higher CPC.
But it can also increase because your conversion rate dropped, your audience changed, your traffic became less relevant, your landing page weakened, your offer became less competitive, or your campaign started attracting lower-intent users.
So before changing the campaign, find which part of the funnel actually deteriorated.
This diagnostic framework shows you how.
First: Understand What Actually Changed
Cost per lead is calculated as:
But this formula hides two major variables:
For example:
Earlier
- CPC \= ₹40
- Landing-page conversion rate \= 10%
- CPL \= ₹400
Now
- CPC \= ₹50
- Conversion rate \= 7%
- CPL ≈ ₹714
CPL increased by almost 79%.
But notice what happened.
It wasn't only CPC.
That distinction matters because each problem requires a different solution.
The 6 Main Reasons CPL Increases
When CPL rises, investigate these areas in order:
- Traffic became more expensive
- Traffic quality declined
- Conversion rate dropped
- Lead qualification changed
- Campaign or audience fatigue developed
- Measurement or tracking changed
Let's diagnose each one.
Your CPC Increased
The simplest explanation is that you're paying more for each click.
This can happen because of:
- increased competition
- changes in auction dynamics
- aggressive competitors
- seasonal demand
- changes in targeting
- lower ad relevance
- bidding changes
- reduced quality or engagement signals
But don't stop at:
Calculate how much of the CPL increase can actually be explained by CPC.
Example
Previous:
- CPC: ₹30
- Conversion rate: 8%
- CPL: ₹375
Current:
- CPC: ₹36
- Conversion rate: 8%
- CPL: ₹450
Here the conversion rate stayed constant.
The CPL increase is primarily a traffic-cost issue.
But if CPC increased from ₹30 to ₹36 while conversion rate fell from 8% to 6%, the problem is much larger.
Now you have both:
That requires a different response.
Your Traffic Quality Changed
This is one of the most overlooked reasons for rising CPL.
You can have a perfectly acceptable CPC while attracting people who are less likely to convert.
For search campaigns, inspect search terms.
Look for:
- informational searches
- research-only queries
- job seekers
- students
- free-resource searches
- unrelated use cases
- low-commercial-intent queries
- irrelevant product variations
For Meta campaigns, examine:
- audience composition
- placement performance
- creative-to-audience fit
- engagement quality
- lead form behavior
- demographic or geographic shifts
Example
Suppose your campaign historically attracted business owners searching for:
But over time it starts receiving more traffic from broader searches such as:
The CPC might still look acceptable.
But conversion probability can be very different.
That means your CPL rises because intent weakened.
The solution isn't necessarily a lower bid.
The solution may be better targeting.
Your Landing Page Conversion Rate Dropped
This is another major cause.
Suppose your campaign generates:
Previously:
Now:
If spend stays constant, CPL increases dramatically.
Why can conversion rate fall?
Possible causes
- landing page changed
- headline became less relevant
- CTA became weaker
- page speed deteriorated
- mobile UX broke
- form stopped working correctly
- offer became less attractive
- traffic intent changed
- trust signals weakened
- ad-to-page message mismatch increased
This is why you should never diagnose a rising CPL by looking only inside the advertising platform.
The problem may be after the click.
Your Offer Became Less Competitive
Sometimes the campaign is working correctly.
The problem is the offer.
Imagine two agencies advertising similar services.
Agency A:
Agency B:
The second offer gives the prospect a clearer reason to act.
If competitors improve their offers while yours stays unchanged, your conversion rate may decline.
And when conversion rate falls:
Review:
- what you're offering
- how specific the offer is
- what happens after conversion
- whether the offer matches buying intent
- whether the prospect understands the value immediately
A weak offer can make an otherwise strong campaign look inefficient.
Your Campaign Has Creative or Audience Fatigue
This is especially relevant to Meta Ads and other audience-driven campaigns.
A creative that worked three months ago may gradually become less effective.
People see the same:
- hook
- image
- video
- headline
- offer
- message
repeatedly.
Eventually engagement can decline.
Then:
Watch for changes in:
- frequency
- CTR
- CPM
- engagement
- conversion rate
- cost per result
But don't automatically assume fatigue just because frequency increased.
Ask whether performance actually deteriorated alongside it.
Your Tracking or Conversion Definition Changed
This is the reason many teams overlook.
Sometimes CPL appears to increase because the measurement changed, not because advertising performance changed.
Examples:
- conversion event was changed
- duplicate conversions were removed
- tracking broke
- form submissions stopped firing
- attribution settings changed
- CRM integration failed
- offline conversions disappeared
- a new conversion action became primary
Imagine your campaign generated 100 real leads.
But tracking recorded only 70.
Your reporting now shows a much higher CPL even though actual lead generation hasn't changed.
Before rebuilding campaigns, verify the measurement.
The Diagnostic Framework: Find the Broken Variable
When CPL rises, compare these metrics against a previous period.
| Metric | Previous | Current | What It May Indicate |
|---|---|---|---|
| Spend | ₹1L | ₹1L | Budget stable |
| Clicks | 2,500 | 2,000 | Traffic efficiency fell |
| CPC | ₹40 | ₹50 | Clicks became more expensive |
| Leads | 200 | 140 | Conversion output declined |
| CVR | 8% | 7% | Landing/traffic issue |
| CPL | ₹500 | ₹714 | Overall efficiency declined |
Now you have something actionable.
Instead of saying:
You can say:
That's a diagnosis.
Diagnose CPL Using the Funnel
Think of the campaign as five stages:
At each stage, ask a different question.
Impression → Click
Check:
- CTR
- CPM
- impression share where relevant
- creative engagement
Click → Landing Page
Check:
- search terms
- audiences
- placements
- keyword intent
- traffic source
Landing Page → Lead
Check:
- conversion rate
- mobile experience
- form completion
- CTA clicks
- page speed
Lead → Qualified Lead
Check:
- qualification rate
- spam
- budget fit
- location
- service requirement
- sales acceptance
Qualified Lead → Customer
Check:
- opportunity rate
- close rate
- CAC
- revenue
This prevents you from optimizing the wrong stage.
Use Cohort Comparisons Instead of Overall CPL
An overall CPL can hide the real problem.
Break performance down by:
- campaign
- ad group
- keyword
- audience
- creative
- placement
- location
- device
- landing page
- date range
Example
Overall CPL increased from ₹500 to ₹700.
But when you break it down:
| Segment | Old CPL | New CPL |
|---|---|---|
| Campaign A | ₹450 | ₹460 |
| Campaign B | ₹500 | ₹520 |
| Campaign C | ₹550 | ₹1,100 |
Now the problem is obvious.
Campaign C is driving the deterioration.
Without segmentation, you might make unnecessary changes across the entire account.
Look for the First Metric That Changed
A useful diagnostic principle is:
Find the first major metric that deteriorated, not just the last metric you noticed.
Suppose:
then
then
then
then
The CPL is the final symptom.
The original problem may have started with the audience or creative.
Changing the landing page alone would not solve it.
Rising CPL on Google Ads: What to Check
For Google Ads, start with:
Search terms
Are new irrelevant searches consuming budget?
Keyword performance
Are previously profitable keywords deteriorating?
Match types and query coverage
Has traffic broadened?
Auction competition
Are competitors becoming more aggressive?
Quality and relevance
Are ads and landing pages aligned with searches?
Location
Are expensive or poor-performing locations consuming more spend?
Device
Is one device generating significantly weaker conversion performance?
Conversion tracking
Are conversions being recorded correctly?
Landing-page performance
Did conversion rate decline after a page or offer change?
Search intent
Are you still capturing commercial demand?
This is where a structured account review can save you from making random changes.
Rising CPL on Meta Ads: What to Check
For Meta campaigns, investigate:
Creative fatigue
Has the audience seen the same message too many times?
Audience size
Is the audience too small for the budget?
Frequency
Is repeated exposure increasing?
CPM
Has the cost of reaching the audience increased?
CTR
Are people becoming less interested in the creative?
Lead conversion rate
Are fewer users completing the form?
Lead quality
Are cheap leads becoming less commercially relevant?
Placement quality
Are some placements generating volume but weak outcomes?
Offer
Does the creative still provide a compelling reason to respond?
The key is to look at these metrics together.
A rising CPM alone doesn't tell you what to fix.
Don't Immediately Lower Your Bids
One of the most common reactions to rising CPL is:
That can reduce traffic.
It doesn't necessarily fix the underlying problem.
If your landing page conversion rate has fallen from 8% to 4%, lowering bids doesn't repair the page.
If irrelevant search terms are consuming your budget, lowering bids doesn't fix search intent.
If your Meta creative is fatigued, lowering bids doesn't create a better message.
Don't Pause Everything at Once
Another common mistake is making too many changes simultaneously.
For example:
- new audiences
- new creatives
- new landing page
- new bidding strategy
- new budget
- new conversion event
all in one week.
Now, even if performance improves, you don't know why.
And if performance gets worse, you don't know which change caused it.
A better approach is to isolate major variables where practical.
For example:
Then:
Then:
This creates cleaner learning.
Build a CPL Change Log
Paid campaigns change constantly.
Document major changes.
| Date | Change | CPL Before | CPL After | Other Metric |
|---|---|---|---|---|
| Jan 5 | New landing page | ₹520 | ₹410 | CVR ↑ |
| Jan 12 | Audience expansion | ₹410 | ₹560 | Quality ↓ |
| Jan 20 | New creative | ₹560 | ₹480 | CTR ↑ |
This creates historical context.
Without a change log, teams often look at the current dashboard and try to guess what happened.
With one, you can connect performance changes to actual campaign changes.
A Practical 30-Minute CPL Audit
If you need to diagnose rising CPL quickly, use this sequence.
First 5 minutes: Compare periods
Compare the current period against a previous period with enough conversion volume.
Check:
- spend
- clicks
- CPC
- leads
- conversion rate
- CPL
Next 5 minutes: Segment
Break CPL down by:
- campaign
- audience/keyword
- location
- device
- creative
Next 5 minutes: Check traffic quality
Review:
- search terms
- audience quality
- placements
- intent
Next 5 minutes: Check conversion
Review:
- landing page
- form
- CTA
- page speed
- tracking
Final 10 minutes: Check business quality
Look at:
- qualified leads
- sales acceptance
- opportunities
- customers
- revenue
This prevents you from treating the advertising dashboard as the entire funnel.
What If CPL Is Increasing but Lead Quality Is Improving?
This is an important exception.
Suppose:
Last month
- CPL \= ₹400
- Qualified lead rate \= 10%
This month
- CPL \= ₹550
- Qualified lead rate \= 20%
The CPL increased.
But the quality doubled.
You shouldn't automatically reverse the changes.
Calculate cost per qualified lead.
Last month:
₹400 ÷ 10% \= ₹4,000 per qualified lead
This month:
₹550 ÷ 20% \= ₹2,750 per qualified lead
The campaign is actually more efficient.
This is why PM-18's focus on reducing CPL without reducing lead quality matters here. The goal is not simply a lower front-end number; it is better economics throughout the funnel.
Create a Simple Decision Tree
When CPL rises:
Is CPC higher?
Yes → investigate auction costs, targeting, competition and traffic quality.
No → move to conversion analysis.
Is conversion rate lower?
Yes → investigate landing page, offer, traffic intent and user experience.
No → move downstream.
Is lead quality lower?
Yes → investigate targeting, qualification and conversion definitions.
No → investigate tracking, sales process and attribution.
This simple sequence can prevent hours of unnecessary campaign changes.
When Should You Be Concerned?
Not every short-term CPL increase is a problem.
Paid campaigns naturally fluctuate.
Be more concerned when:
- the increase persists across multiple periods
- qualified-lead volume declines
- conversion rate remains weak
- CPC continues rising
- lead quality deteriorates
- customer acquisition cost increases
- revenue efficiency falls
The important word is persistent.
Don't rebuild an account because of two bad days.
Look for a meaningful pattern.
The Right Optimization Order
When CPL is increasing, use this order:
This is much safer than changing everything because the CPL column turned red.