
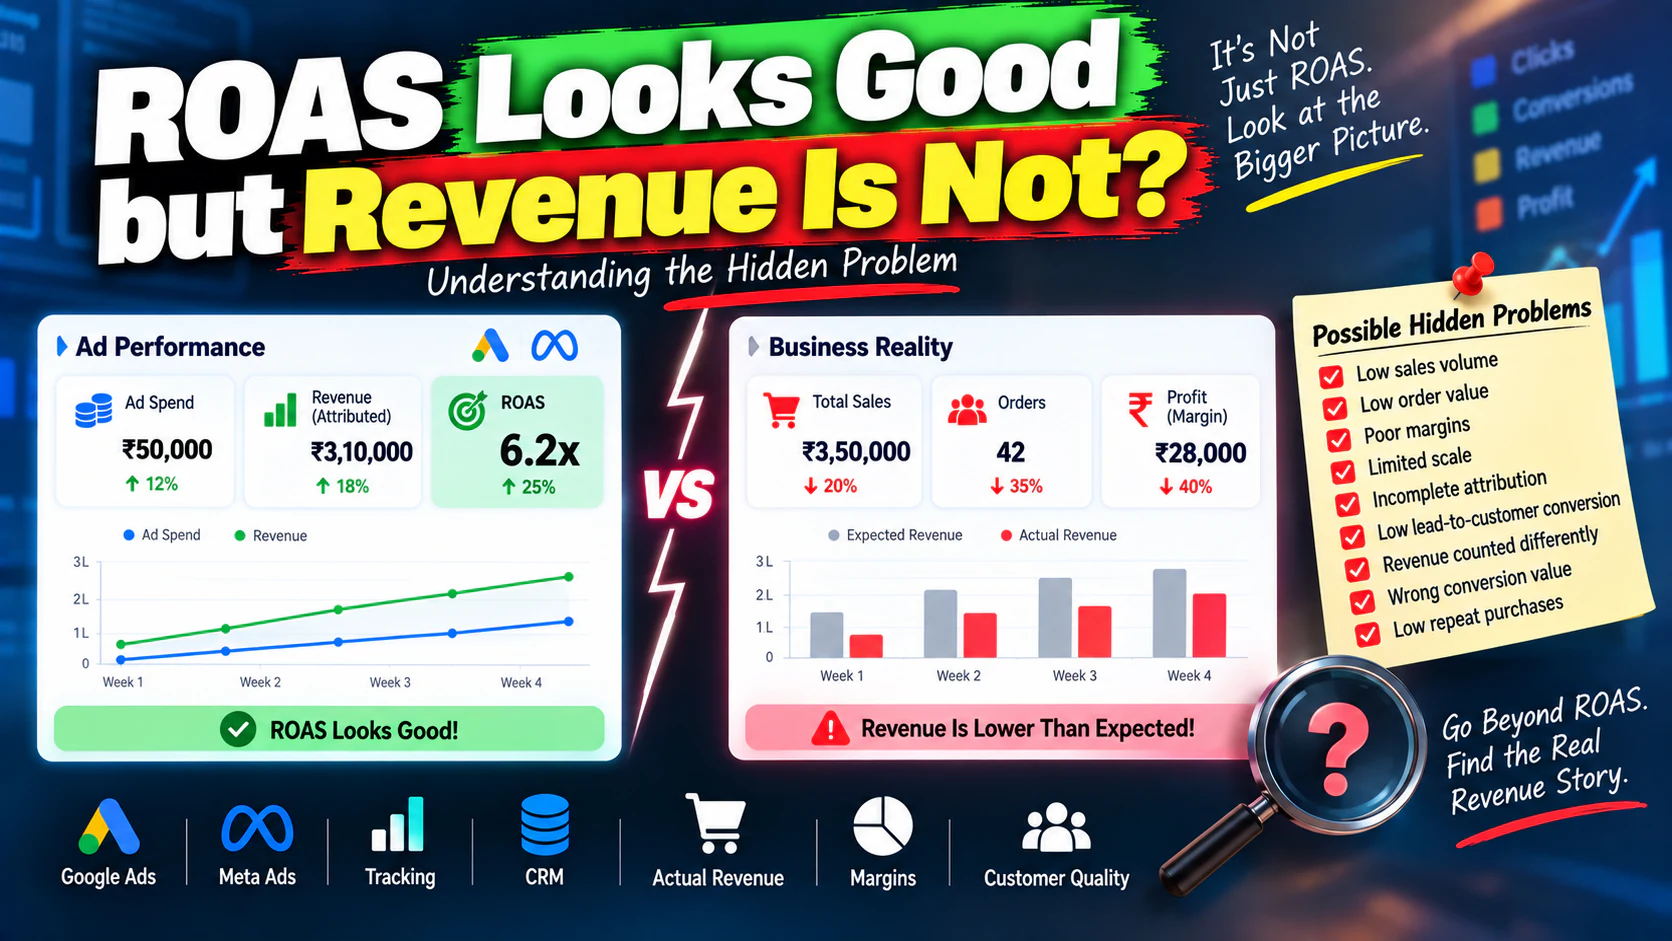
Your Google Ads or Meta Ads dashboard says:
That sounds excellent.
So why does the business owner still ask:
This situation is more common than it looks.
A campaign can show an attractive ROAS while the business generates less revenue than expected.
Sometimes the problem is not the advertising platform.
The problem is that ROAS measures only part of the business equation.
A high ROAS can hide:
- low sales volume
- low order value
- poor margins
- limited scale
- incomplete attribution
- low repeat purchases
- weak lead-to-customer conversion
- revenue being counted differently across systems
- campaigns optimized toward the wrong conversion value
So if your ROAS looks good but revenue doesn't, don't immediately increase the budget.
First find out what the ROAS number is actually telling you.
What Does ROAS Actually Measure?
ROAS means:
The basic formula is:
For example:
- Ad spend \= ₹1,00,000
- Attributed revenue \= ₹5,00,000
- ROAS \= 5x
That means the platform attributes ₹5 in revenue for every ₹1 spent on advertising.
But it does not automatically tell you:
- how much profit you made
- how many customers you acquired
- whether you can scale the campaign
- whether revenue is being attributed correctly
- whether customers will buy again
- whether operating costs are covered
That's why a 5x ROAS should be treated as a performance signal, not a complete business-health metric.
How Can ROAS Be High While Revenue Is Low?
Consider two campaigns.
Campaign A
- Spend: ₹10,000
- Revenue: ₹60,000
- ROAS: 6x
Campaign B
- Spend: ₹1,00,000
- Revenue: ₹4,00,000
- ROAS: 4x
Campaign A has the better ROAS.
Campaign B generates substantially more revenue.
If your business needs volume, Campaign B may be more valuable.
This is the first hidden problem:
Efficiency and scale are not the same thing.
A tiny campaign can have fantastic ROAS because it captures a small amount of highly efficient demand.
That doesn't mean it can generate enough revenue to move the business.
Problem 1: You're Looking at Percentage Efficiency Instead of Revenue Volume
Suppose your campaign produces:
ROAS \= 5x.
You increase the budget to ₹20,000.
But revenue becomes only ₹80,000.
ROAS falls to 4x.
You might think:
But revenue increased by ₹30,000.
If the business needs more sales, that additional revenue may be more important than protecting the original 5x ROAS.
This is why scaling decisions need to consider both:
not just ROAS.
Problem 2: Your ROAS Target Is Too High for the Business Goal
Some companies become obsessed with maintaining a specific ROAS target.
For example:
The campaign reaches 5x.
So budget is reduced.
Then:
- impressions decline
- clicks decline
- orders decline
- revenue declines
The business technically maintains its ROAS target.
But it has fewer customers.
A ROAS target should support the economics and growth strategy of the business.
It should not become a number that prevents profitable growth.
Problem 3: Your Average Order Value Is Too Low
ROAS can look healthy even when the absolute revenue generated per transaction is not enough to create meaningful growth.
Imagine:
- 100 orders
- Average order value \= ₹1,000
- Revenue \= ₹1,00,000
- Ad spend \= ₹20,000
- ROAS \= 5x
The ROAS looks strong.
But if the business needs ₹10 lakh in monthly revenue, this campaign isn't generating enough volume.
You need to ask:
Not just:
Problem 4: High ROAS Can Come From Retargeting
Retargeting campaigns often receive credit for users who already know your brand.
A customer might:
- discover your brand through organic search
- visit your website
- leave
- see a retargeting ad
- return
- purchase
The retargeting campaign may receive attribution for the purchase.
That doesn't necessarily mean the retargeting ad created the entire demand.
This is why comparing:
with
without considering the customer journey can be misleading.
Retargeting often works closer to the bottom of the funnel.
It may produce excellent efficiency.
But it may have limited ability to create new demand at scale.
Problem 5: Attribution Is Making the ROAS Look Better
Your advertising platform and your finance system may not report revenue in exactly the same way.
The ad platform may report:
while your actual sales system reports:
That difference needs investigation.
Potential reasons include:
- attribution windows
- cross-channel interactions
- duplicate conversion values
- returns
- cancellations
- refunds
- taxes
- different revenue definitions
- offline sales
- CRM or ecommerce tracking differences
This doesn't automatically mean the ad platform is wrong.
It means you need to understand what each system is measuring.
For serious performance analysis, attribution should not be treated as a simple number you copy from the advertising dashboard.
Problem 6: You're Measuring Revenue but Ignoring Profit
This is one of the biggest traps.
Suppose:
- Revenue \= ₹10,00,000
- Ad spend \= ₹2,00,000
- ROAS \= 5x
Looks great.
But now include:
- product cost
- shipping
- payment fees
- discounts
- returns
- agency fees
- operational costs
The actual contribution may be much smaller.
ROAS answers:
It does not answer:
That is why businesses should also understand profitability and contribution margin.
Problem 7: Your Conversion Value Is Not Your Real Revenue
Advertising platforms depend on conversion data.
If the value being sent to the platform is incorrect, your ROAS is also misleading.
For example:
Actual order value:
Tracked conversion value:
The platform thinks it generated more revenue than it actually did.
Now your reported ROAS looks stronger than reality.
Check:
- ecommerce revenue values
- transaction IDs
- purchase events
- duplicate events
- refunds
- cancellations
- currency
- taxes
- discounts
Your ROAS is only as reliable as the revenue data behind it.
Problem 8: Lead Generation Businesses Have a Different ROAS Problem
For lead-generation businesses, ROAS can become even more complicated.
A lead is not revenue.
Suppose:
- Ad spend \= ₹1,00,000
- Leads \= 200
- Estimated lead value \= ₹5,000
- Platform reports strong conversion value
But only 10 leads become customers.
The real revenue depends on:
A campaign can look excellent at the lead level while producing weak sales.
For service businesses, B2B companies and high-ticket businesses, you often need to evaluate:
- cost per qualified lead
- opportunity rate
- customer acquisition cost
- close rate
- average contract value
- revenue per customer
This is why lead quality and downstream conversion matter as much as front-end campaign metrics.
Problem 9: You Are Comparing Different Funnel Stages
A prospecting campaign and a retargeting campaign should not always have identical expectations.
For example:
Prospecting
Goal:
Retargeting
Goal:
The retargeting campaign may naturally produce stronger ROAS.
That doesn't mean you should move the entire budget into retargeting.
There may simply not be enough retargeting audience to sustain meaningful growth.
If you spend more aggressively there, frequency can increase while incremental revenue decreases.
Problem 10: Your Best ROAS Campaign May Be Too Small
This happens frequently.
Imagine:
| Campaign | Spend | Revenue | ROAS |
|---|---|---|---|
| Campaign A | ₹10K | ₹70K | 7x |
| Campaign B | ₹1L | ₹5L | 5x |
| Campaign C | ₹3L | ₹12L | 4x |
Campaign A has the highest ROAS.
But Campaign C generates the most revenue.
If the objective is growth, killing Campaign C simply because its ROAS is lower could be a mistake.
The better question is:
Don't Ask "Is My ROAS Good?"
Ask These 7 Questions Instead
A ROAS number has meaning only within a business context.
Ask:
How much revenue did the campaign actually generate?
How much incremental revenue did it create?
What was the gross or contribution margin?
How much did we spend to acquire the customer?
How much of the revenue was genuinely attributable to paid advertising?
Can the campaign scale without destroying economics?
Does the customer generate additional value after the first purchase?
These questions turn ROAS from a dashboard metric into a business metric.
ROAS vs Revenue vs Profit
Consider this example.
Campaign A
- Spend: ₹50,000
- Revenue: ₹3,00,000
- ROAS: 6x
- Contribution margin: 20%
- Contribution: ₹60,000
Campaign B
- Spend: ₹2,00,000
- Revenue: ₹8,00,000
- ROAS: 4x
- Contribution margin: 35%
- Contribution: ₹2,80,000
Campaign A has the better ROAS.
Campaign B creates significantly more contribution.
That is why optimizing purely for ROAS can sometimes push businesses toward the wrong decision.
The Hidden Metric: Incremental Revenue
One of the hardest questions in paid advertising is:
Suppose a customer was already searching for your brand and was likely to purchase.
A branded search ad may receive conversion credit.
But did the ad create the sale?
This is where incrementality becomes important.
Instead of only asking:
ask:
That is a much more difficult question.
But it is closer to actual business impact.
How to Diagnose High ROAS but Low Revenue
Use this sequence.
Check campaign spend
Is the campaign actually spending enough to produce the required revenue?
If not, high ROAS may simply reflect limited volume.
Check conversion volume
How many actual transactions or customers are being generated?
Check average order value
Is each transaction large enough?
Check new vs returning customers
Is revenue mostly coming from existing customers?
Check prospecting vs retargeting
Where is revenue actually being generated?
Verify attribution
Does platform revenue match your internal sales data reasonably?
Check margins
Is the attributed revenue actually profitable?
Check scalability
Can you increase spend while maintaining acceptable economics?
This gives you a much more complete picture.
What to Do If ROAS Is High but Revenue Is Low
The answer depends on the diagnosis.
If the campaign is too small
Increase budget gradually if sufficient demand exists.
If prospecting is weak
Improve:
- creative
- targeting
- audience strategy
- offers
- landing pages
If retargeting dominates
Build stronger upper- and mid-funnel acquisition.
If conversion volume is low
Improve the conversion funnel.
If AOV is low
Test:
- bundles
- upsells
- cross-sells
- minimum-order incentives
- higher-value products
If attribution is unreliable
Fix tracking before making major budget decisions.
If profit margins are weak
Optimize for contribution economics rather than revenue alone.
A Better Paid Marketing Scorecard
Instead of using only ROAS, build a wider scorecard.
Acquisition
- impressions
- CTR
- CPC
- CPM
Conversion
- conversion rate
- cost per conversion
- CPL
- CPQL
Sales
- qualified leads
- opportunities
- customers
- close rate
Revenue
- revenue
- average order value
- revenue per customer
Economics
- CAC
- contribution margin
- profit
- LTV
Growth
- new customers
- repeat customers
- incremental revenue
- scalable spend
This creates a much more realistic picture of campaign performance.
When Should You Accept a Lower ROAS?
Sometimes, deliberately.
Suppose a campaign currently produces:
at ₹50,000 monthly spend.
You increase spending.
Now:
at ₹2,00,000 spend.
If the additional spend creates substantial profitable revenue, the lower ROAS may be acceptable.
The correct threshold depends on:
- margins
- CAC target
- customer lifetime value
- business objectives
- cash flow
- inventory
- sales capacity
There is no universal “good ROAS.”
A 3x ROAS can be excellent for one business and terrible for another.
A Practical ROAS Audit
Before changing your campaign, collect these numbers:
Then compare the numbers.
If the platform says:
and the business system says:
don't simply optimize the campaign based on the ₹10 lakh figure.
Find the reason for the difference.
The 5 Mistakes to Avoid
Mistake 1: Chasing the highest ROAS
High ROAS does not automatically mean high growth.
Mistake 2: Cutting campaigns because ROAS fell
A lower ROAS can accompany higher profitable revenue.
Mistake 3: Treating attributed revenue as guaranteed incremental revenue
Attribution is not the same as causation.
Mistake 4: Ignoring margins
Revenue is not profit.
Mistake 5: Optimizing without checking tracking
Bad conversion data creates bad optimization decisions.
The Better Optimization Model
Think of paid advertising as three layers.
Layer 1 — Efficiency
Metrics:
CPC, CPL, CPA, ROAS.
Layer 2 — Business value
Metrics:
qualified leads, customers, revenue, CAC.
Layer 3 — Growth
Metrics:
incremental revenue, contribution, LTV, scalable spend.
A mature performance marketing strategy considers all three.