
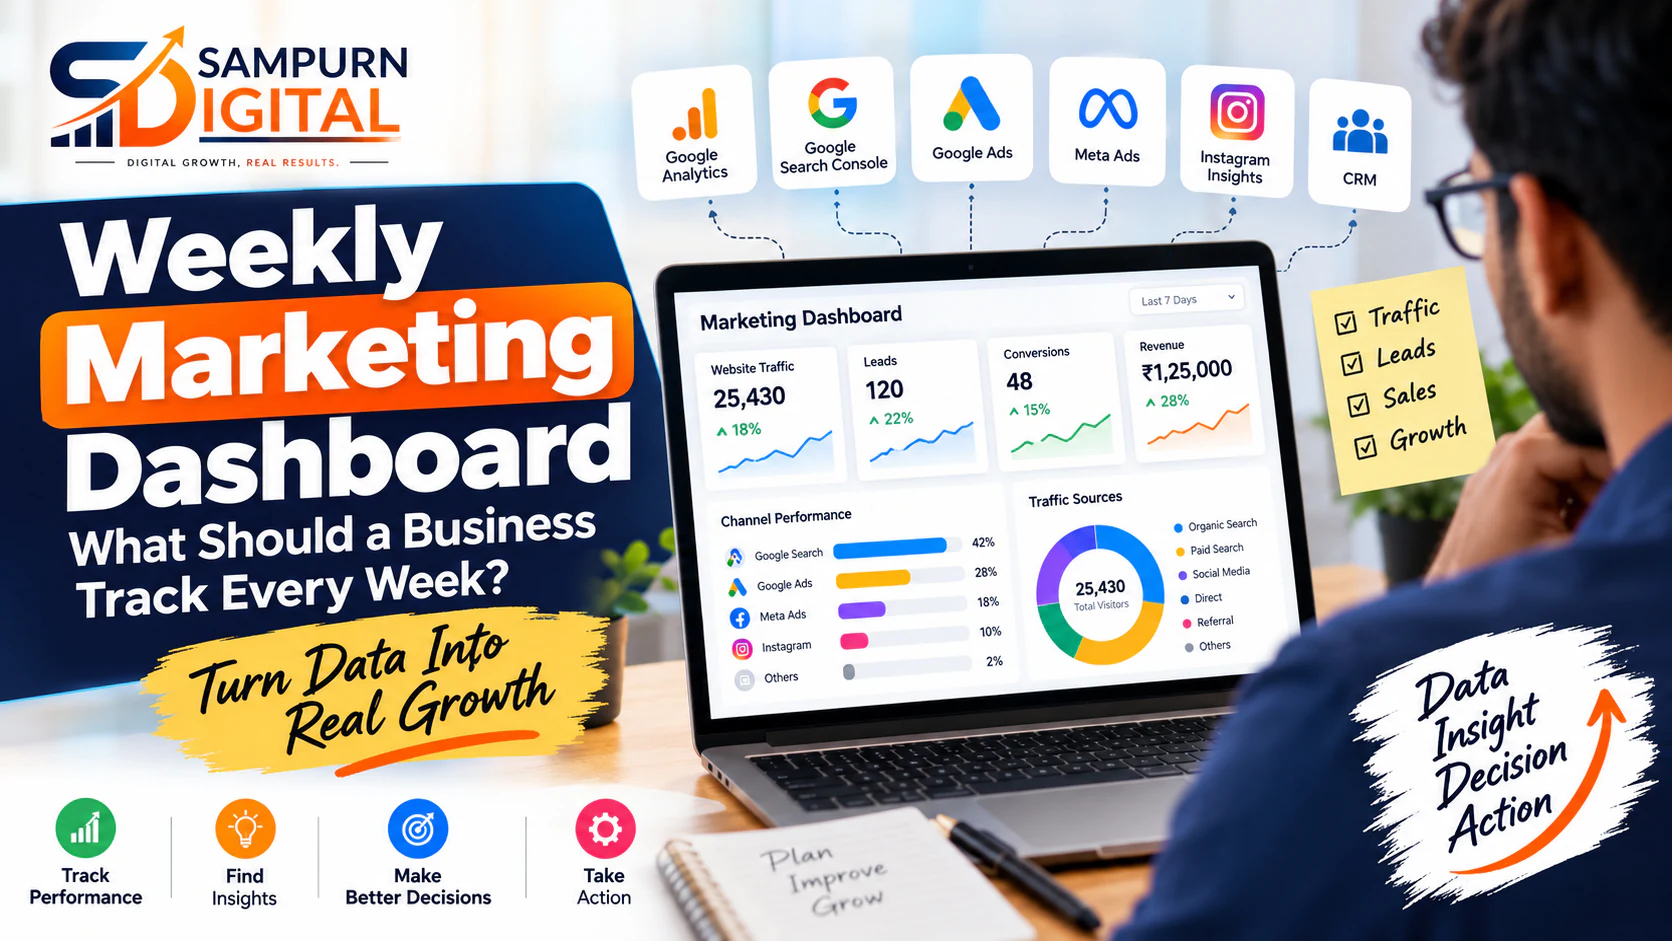
Most businesses don't have a data problem.
They have a decision problem.
They have Google Analytics.
They have Google Search Console.
They have Google Ads.
They have Meta Ads.
They have Instagram Insights.
They may even have a CRM.
But when Monday morning comes and someone asks:
"How did our digital marketing perform last week?"
the answer is often:
"We got 25,000 impressions."
"Website traffic increased by 18%."
"We got 120 leads."
Those numbers may be useful.
But they don't necessarily tell you what happened to the business.
A proper weekly marketing dashboard should help answer five questions:
- Did we generate the right traffic?
- Did people take meaningful actions?
- Which channels performed?
- Did lead quality improve?
- What should we change next week?
That's what a useful digital marketing dashboard should accomplish.
What Is a Digital Marketing Dashboard?
A digital marketing dashboard is a structured view of the most important marketing and business metrics in one place.
Instead of opening:
- Google Analytics
- Search Console
- Google Ads
- Meta Ads
- Social analytics
- CRM
- E-commerce platform
you create one reporting layer containing the metrics your business actually needs.
The objective isn't to put every available number on one screen.
The objective is to make important trends obvious.
Think:
rather than:
Why Should Businesses Review Marketing Performance Every Week?
Monthly reporting can be useful for strategic analysis.
But waiting an entire month to discover a problem can be expensive.
Imagine your Google Ads campaign normally produces:
During Week 1:
Week 2:
Week 3:
Week 4:
If you only look at the monthly report, you may discover the problem after spending most of the budget.
A weekly review gives you an opportunity to ask:
"What changed?"
and:
"What should we fix before next week?"
The 5 Levels of a Marketing Dashboard
A strong dashboard should move from basic activity to business impact.
Level 1 — Reach
How many people did we reach?
Level 2 — Traffic
How many people visited?
Level 3 — Engagement
What did they do?
Level 4 — Conversion
How many became leads/customers?
Level 5 — Revenue
What business value did marketing generate?
The higher levels are usually more important for business decisions.
The Most Important Weekly Marketing Dashboard Metrics
For most businesses, start with these categories:
| Category | Metrics |
|---|---|
| Traffic | Users, sessions, source/medium |
| SEO | Organic clicks, impressions, rankings, conversions |
| Paid | Spend, clicks, CPC, conversions, CPL |
| Social | Reach, engagement, clicks, leads |
| Website | Landing-page performance, conversion rate |
| Leads | Leads, qualified leads, lead quality |
| Sales | Opportunities, customers, revenue |
| Efficiency | CAC, CPL, ROAS where applicable |
Not every business needs every metric.
Your dashboard should reflect your business model.
Website Traffic
Start with:
- Total users
- Sessions
- New users
- Returning users
- Traffic source
- Landing pages
But don't stop at total traffic.
Suppose:
Week 1
10,000 visitors
Week 2
15,000 visitors
Traffic increased by:
Sounds good.
But what if leads changed from:
Now conversion efficiency has declined.
That's why traffic should always be reviewed alongside conversions.
Traffic by Channel
Break traffic into meaningful sources.
For example:
| Channel | Visitors | Leads | Conversion Rate |
|---|---|---|---|
| Organic | 5,000 | 150 | 3.0% |
| Google Ads | 3,000 | 120 | 4.0% |
| Social | 2,500 | 35 | 1.4% |
| Direct | 1,500 | 45 | 3.0% |
Now you have something useful to investigate.
Social generated less direct conversion than Google Ads.
But that doesn't automatically mean social is ineffective.
It may contribute earlier in the customer journey.
This is where attribution becomes important.
Leads
For service businesses, lead generation is often one of the most important dashboard sections.
Track:
- Total leads
- Qualified leads
- Unqualified leads
- Lead source
- Cost per lead
- Cost per qualified lead
- Lead-to-opportunity rate
- Lead-to-customer rate
For example:
Now you can identify where the funnel is leaking.
Lead Quality
A dashboard that tracks only lead volume can create bad marketing decisions.
Imagine:
Campaign A
Campaign B
Campaign A generated more leads.
Campaign B generated more customers.
Therefore, the dashboard should move beyond:
to:
Cost Per Lead
The basic formula is:
Example:
Marketing spend:
Leads:
CPL:
But don't evaluate CPL alone.
If Campaign A produces:
and Campaign B:
Campaign A looks cheaper.
But suppose:
Campaign A produces 5 customers.
Campaign B produces 15 customers.
The cheaper lead may not be the more valuable lead.
Cost Per Qualified Lead
For lead-generation businesses, this can be more useful.
Formula:
Example:
₹60,000 spend
30 qualified leads
Now compare channels based on the leads your sales team actually wants.
Customer Acquisition Cost
CAC measures the cost associated with acquiring customers.
A simple version is:
Suppose:
Marketing + sales acquisition cost:
New customers:
CAC:
Then compare that with customer value.
If average customer value is:
the economics clearly need attention.
If average customer value is:
the same acquisition cost may be more sustainable.
SEO Metrics
Your weekly SEO dashboard can include:
Visibility
- Organic clicks
- Organic impressions
- Average position
- Indexed pages
Performance
- Organic users
- Landing pages
- Click-through rate
Business
- Organic leads
- Organic conversions
- Organic revenue where measurable
Don't make rankings the only SEO KPI.
A keyword moving from position:
is useful.
But if it produces no relevant traffic or business activity, its commercial importance may be limited.
SEO Reporting Should Connect to Business
A useful SEO report might look like:
| Metric | Last Week | This Week | Change |
|---|---|---|---|
| Organic clicks | 8,200 | 8,900 | +8.5% |
| Organic leads | 145 | 162 | +11.7% |
| Qualified leads | 42 | 51 | +21.4% |
| Organic customers | 9 | 11 | +22.2% |
This tells a much stronger story than:
"We rank for 300 keywords."
Google Ads Metrics
For paid search, consider tracking:
- Spend
- Impressions
- Clicks
- CTR
- CPC
- Conversions
- Conversion rate
- CPL
- Qualified leads
- Cost per qualified lead
- Revenue
- ROAS where applicable
For example:
Spend: ₹50,000
Clicks: 1,000
CPC: ₹50
Leads: 50
CPL: ₹1,000
Now add:
Qualified leads: 20
CPQL: ₹2,500
That's much more useful for decision-making.
Your paid-ads dashboard should complement the deeper paid-performance analysis covered in the cluster's weekly paid ads performance dashboard guide.
Social Media Metrics
Social dashboards often become overloaded.
You don't necessarily need to track:
- Every reaction
- Every sticker tap
- Every profile visit
- Every content interaction
Instead, focus on the metrics connected to your objective.
Awareness
- Reach
- Impressions
- Video views
Engagement
- Engagement rate
- Saves
- Shares
- Comments
Traffic
- Website clicks
- Landing-page visits
Business
- Leads
- Purchases
- Assisted conversions where measurable
A Reel with 100,000 views isn't automatically more valuable than one with 10,000 views.
If the 10,000-view Reel produces 50 qualified leads and the 100,000-view Reel produces none, the business should investigate why.
Website Conversion Rate
A simple formula:
Suppose:
10,000 visitors
200 leads
Conversion rate:
Next month:
10,500 visitors
262 leads
Conversion rate:
Traffic increased only:
But leads increased:
That is why conversion rate belongs on the marketing dashboard.
Landing-Page Performance
Track your important landing pages separately.
For example:
| Landing Page | Visitors | Leads | CVR |
|---|---|---|---|
| SEO Services | 2,000 | 70 | 3.5% |
| Google Ads | 1,500 | 75 | 5.0% |
| Web Development | 1,200 | 24 | 2.0% |
| Social Media | 1,000 | 18 | 1.8% |
Now the marketing team has a starting point for optimization.
The question becomes:
"Why is the Google Ads page converting at 5% while the Social Media page converts at 1.8%?"
That is a better question than:
"How much traffic did the website get?"
Engagement Metrics: Use Them Carefully
Engagement metrics can help diagnose behaviour.
Examples:
- Engaged sessions
- Time spent
- Scroll depth
- Pages per session
- Video engagement
But don't turn them into vanity KPIs.
A visitor spending 5 minutes on a page isn't automatically valuable.
They may have been confused.
Another visitor may spend 60 seconds, understand the offer and submit a lead.
The business outcome matters.
Revenue
Whenever possible, connect marketing activity to:
For e-commerce:
- Purchases
- Revenue
- Average order value
- ROAS
- Customer acquisition cost
For service businesses:
- Qualified leads
- Opportunities
- Closed deals
- Revenue
- CAC
This changes the marketing conversation completely.
Instead of:
"We got 1 million impressions."
You can discuss:
"This channel generated 18 qualified opportunities and ₹9 lakh in closed revenue."
The Weekly Dashboard Should Tell a Story
Don't simply present 40 metrics.
Create a narrative.
What happened?
Traffic increased 12%.
Why?
Organic traffic increased after new service pages started receiving impressions.
What changed?
Organic leads increased 18%.
What is concerning?
Paid lead volume remained stable but qualified lead rate fell.
What are we doing?
Review targeting and search terms.
That's a useful weekly marketing review.
Use a Red / Yellow / Green Diagnostic System
You can create simple status indicators.
Green
Performance is within or above target.
Yellow
Performance requires monitoring.
Red
Performance requires investigation/action.
Example:
| KPI | Target | Actual | Status |
|---|---|---|---|
| Organic leads | 150 | 172 | Green |
| Paid CPL | ₹1,500 | ₹1,650 | Yellow |
| Qualified lead rate | 30% | 19% | Red |
| Website CVR | 2.5% | 2.8% | Green |
The status should trigger a question, not automatically dictate the answer.
Compare Against the Right Benchmark
Avoid comparing every metric with the previous week without context.
For example:
Monday traffic may be different from Sunday traffic.
Festival periods may distort performance.
A campaign launch may create unusual spikes.
Seasonality can change demand.
Better comparisons can include:
- Previous week
- Previous month
- Same period last year
- Campaign period
- Target/forecast
Choose the comparison that matches the business question.
Weekly Marketing Dashboard Template
A practical dashboard can contain these sections.
Executive Summary
Traffic: +12%
Leads: +8%
Qualified Leads: +14%
Revenue: +11%
Main Issue: Paid CPL increased.
Main Opportunity: Organic service-page traffic increased.
Channel Performance
| Channel | Spend | Traffic | Leads | Qualified Leads | Customers |
|---|---|---|---|---|---|
| SEO | — | 8,500 | 180 | 58 | 14 |
| Google Ads | ₹60,000 | 3,000 | 120 | 35 | 10 |
| Meta Ads | ₹40,000 | 2,800 | 75 | 18 | 5 |
| Social Organic | — | 1,900 | 30 | 9 | 2 |
Website Performance
| Metric | This Week | Last Week | Change |
|---|---|---|---|
| Users | 16,200 | 14,800 | +9.5% |
| Leads | 405 | 375 | +8.0% |
| CVR | 2.50% | 2.53% | -0.03 pp |
| Phone clicks | 210 | 185 | +13.5% |
SEO
- Organic clicks
- Impressions
- Top landing pages
- Organic conversions
- Important ranking changes
- Technical issues
Paid
- Spend
- Leads
- CPL
- Qualified leads
- CPQL
- Conversion rate
- Revenue/ROAS where applicable
Social
- Reach
- Engagement
- Website clicks
- Leads
- Top-performing content
What Should You Actually Discuss in a Weekly Marketing Meeting?
Don't spend 60 minutes reading numbers.
Use the dashboard to discuss:
Biggest improvement
What improved?
Biggest decline
What deteriorated?
Biggest opportunity
Where is there evidence of upside?
Biggest risk
What could become expensive if ignored?
Next action
What will the team change?
A dashboard is useful only if it changes decisions.
Example Weekly Marketing Review
Imagine this week's data:
Organic traffic: +20%
Organic leads: +8%
Google Ads spend: +15%
Paid leads: +3%
Social reach: +40%
Social leads: +5%
What should the team investigate?
SEO
Traffic is growing faster than leads.
Check:
- Which pages gained traffic?
- Is the new traffic relevant?
- Are commercial pages converting?
- Did informational traffic increase disproportionately?
Paid
Spend increased much faster than leads.
Check:
- CPC
- Search terms
- Conversion rate
- Landing pages
- Lead quality
Social
Reach increased substantially but leads barely moved.
Check:
- Content intent
- CTA
- Website journey
- Audience
- Landing pages
Now the dashboard has generated actual marketing questions.
Don't Let One Metric Control the Decision
Suppose CPL increases by 20%.
Don't immediately:
First ask:
- Did lead quality improve?
- Did average customer value increase?
- Did conversion rate change?
- Did CPC increase?
- Did the audience change?
- Did the offer change?
- Did the landing page change?
Similarly, if traffic drops:
Don't immediately assume SEO failed.
Investigate:
- Which pages lost traffic?
- Which queries changed?
- Was there seasonality?
- Did rankings change?
- Did tracking change?
The dashboard should trigger diagnosis.
Marketing Dashboard vs Marketing Report
They are related but different.
Dashboard
A continuously accessible view of important metrics.
Weekly report
A structured interpretation of what those metrics mean.
For example:
Dashboard: Paid CPL = ₹1,850
Report: Paid CPL increased 23% because CPC increased and landing-page conversion rate declined. Search-term analysis and landing-page review are the next actions.
The second is much more useful to a business owner.
Build Dashboards for Different Stakeholders
Not everyone needs the same dashboard.
Business Owner
Focus on:
- Leads
- Qualified leads
- Customers
- Revenue
- CAC
- Channel performance
Marketing Manager
Focus on:
- Traffic
- Conversion rate
- Campaign performance
- CPL
- CPQL
- Content performance
SEO Specialist
Focus on:
- Organic clicks
- Impressions
- CTR
- Rankings
- Landing pages
- Organic conversions
Paid Ads Specialist
Focus on:
- Spend
- CPC
- CTR
- Search terms
- Conversion rate
- CPL
- CPQL
One dashboard can serve everyone, but different views make decision-making easier.
The 20-Metric Weekly Dashboard
If you want a simple starting point, use these 20 metrics.
Business
- Leads
- Qualified leads
- Customers
- Revenue
- CAC
Website
- Users
- Conversion rate
- Top landing pages
- Form submissions
- Calls/WhatsApp enquiries
SEO
- Organic clicks
- Organic impressions
- Organic conversions
Paid
- Ad spend
- Clicks
- CPC
- Leads
- CPL
Social
- Reach
- Website clicks/leads
Then expand only when additional metrics answer an important business question.
The 80/20 Rule for Marketing Dashboards
If your dashboard contains:
but nobody knows what to do with them, it isn't helping.
A better approach is:
For example:
Key Insights
- Organic service traffic increased.
- Paid CPL increased.
- Social reach grew but conversion remained flat.
- Website conversion rate improved.
- Qualified lead rate declined.
Next Actions
- Review paid search terms.
- Improve the social-to-website journey.
- Investigate lead qualification quality.
That's a decision-making dashboard.
Common Marketing Dashboard Mistakes
Mistake 1: Tracking vanity metrics
Followers and impressions can be useful, but they shouldn't dominate a revenue-focused dashboard.
Mistake 2: No targets
A number without context is difficult to interpret.
Mistake 3: Too many metrics
More data doesn't automatically mean better decisions.
Mistake 4: Reporting without analysis
A dashboard should explain what changed.
Mistake 5: Ignoring lead quality
100 poor leads can be worse than 30 qualified leads.
Mistake 6: No channel comparison
You need to understand where business outcomes originate.
Mistake 7: No action plan
Every major issue should have an owner and next step.
How to Build Your Weekly Dashboard in 7 Steps
Define the business goal
Revenue? Leads? Sales? E-commerce purchases?
Define primary conversions
Choose the actions that matter.
Map channels
SEO, Google Ads, Meta, social, email, referrals, etc.
Select KPIs
Choose only metrics that help answer business questions.
Set targets
Example:
Add comparisons
Previous week, previous month or target.
Add action tracking
For every major issue:
Now the dashboard becomes an operating tool.
A Simple Weekly Marketing Dashboard for a Small Business
If you're a small business and don't have a large marketing team, start with:
Traffic
- Website visitors
- Organic visitors
- Paid visitors
- Social visitors
Leads
- Total leads
- Qualified leads
- Lead source
Paid
- Spend
- Leads
- CPL
SEO
- Organic clicks
- Top landing pages
- Organic leads
Social
- Reach
- Website clicks
- Leads
Business
- Customers
- Revenue
- CAC
That's enough to start making better weekly decisions.
The Most Important Question
At the end of every weekly review, ask:
"What are we going to do differently next week because of this data?"
If the answer is:
"Nothing."
then the dashboard is probably functioning as a reporting document rather than a decision-making system.
A strong dashboard should lead to action.
Need Help Building a Marketing Dashboard?
Sampurn Digital can help you structure a practical digital marketing measurement system covering SEO, paid advertising, social media, website performance, leads and business KPIs.