
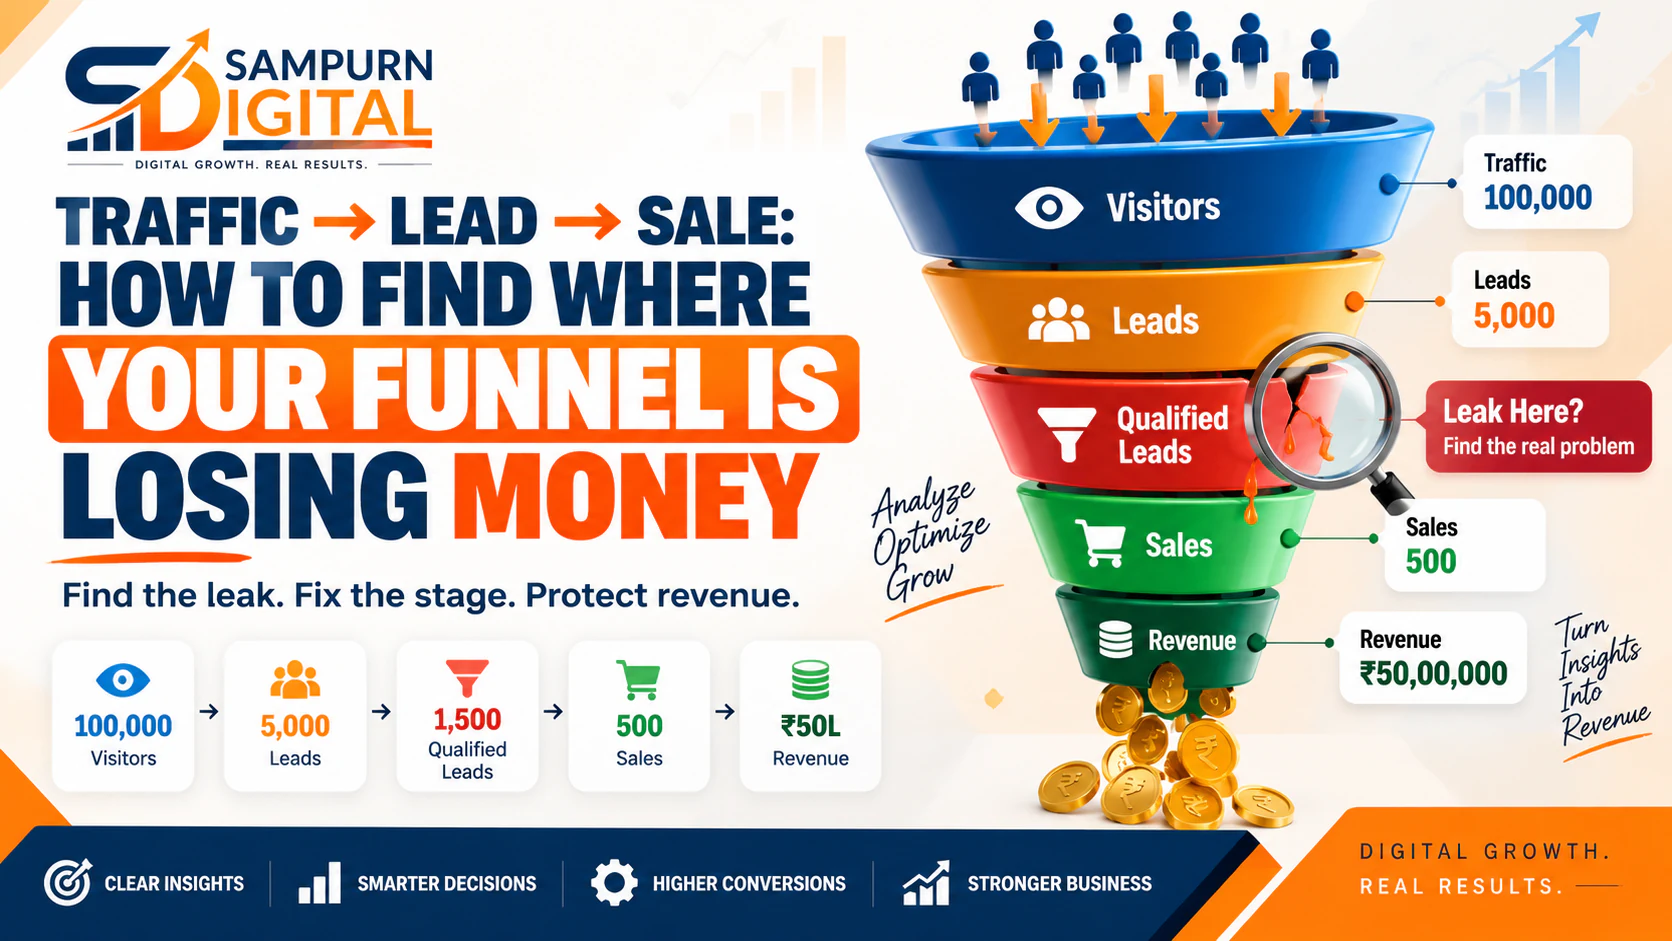
Getting traffic is not the same as generating leads. Generating leads is not the same as generating sales.
A business can have thousands of website visitors, a growing lead count, and active marketing campaigns—and still lose money somewhere between the first click and the final sale.
The real question is not:
It is:
This guide shows you how to diagnose the journey from traffic → lead → sale, identify the biggest leak, and prioritize the fix that can have the greatest business impact.
First: Don't Assume the Problem Is Traffic
When sales are disappointing, businesses often start by looking at traffic.
They may ask:
- Should we increase SEO?
- Should we run more ads?
- Should we post more on social media?
- Should we increase the marketing budget?
- Should we get more website visitors?
But more traffic does not automatically solve a broken funnel.
Imagine this:
| Funnel Stage | Example |
|---|---|
| Website visitors | 10,000 |
| Leads | 200 |
| Qualified leads | 60 |
| Sales | 6 |
| Average sale value | ₹50,000 |
| Revenue | ₹3,00,000 |
The business generated 10,000 visits, but only six became customers.
Increasing traffic to 20,000 visitors may produce more revenue—but if the underlying conversion problem remains, the business may simply be paying to send more people into a leaky funnel.
This is why funnel leakage analysis should happen before simply increasing marketing activity.
Map the Funnel Before Trying to Fix It
Start by making the customer journey visible.
A basic funnel looks like:
Each stage answers a different question.
Traffic
Are the right people arriving?
Landing page or website
Do visitors understand what you offer and what they should do next?
Lead
Are visitors taking the intended action?
Qualified lead
Are those leads actually relevant to your business?
Sales opportunity
Does the sales team have enough information and intent to move forward?
Customer
Are opportunities converting into actual purchases?
Revenue
Is the resulting revenue sufficient to justify acquisition costs?
This distinction matters because every stage can fail for a different reason.
Separate Traffic Problems From Conversion Problems
The first diagnostic step is determining whether the problem happens before or after the visitor reaches your website.
Suppose your traffic has fallen by 40%.
That points toward questions such as:
- Has organic visibility declined?
- Did paid traffic decrease?
- Did campaign targeting change?
- Did search demand change?
- Did social reach decline?
- Did a major traffic source stop contributing?
But suppose traffic increased by 40% while leads stayed flat.
That is a different problem.
You should investigate:
- traffic quality
- search intent
- audience targeting
- landing-page relevance
- offer clarity
- calls to action
- form friction
- website experience
If you want to understand why traffic can increase without producing enough customers, start with [how to improve your digital marketing is getting traffic but not enough customers](https://www.sampurndigital.com/blog/digital-marketing/why-your-digital-marketing-is-getting-traffic-but-not-enough-customers).
The important principle is:
Do not optimize the stage that is already working. Find the first major bottleneck.
Measure Every Conversion Step
A funnel cannot be diagnosed using traffic and revenue alone.
Track the transitions between stages.
For example:
Lead Conversion Rate=LeadsVisitors×100Lead\\ Conversion\\ Rate \= \\frac{Leads}{Visitors} \\times 100
If you have:
- 10,000 visitors
- 200 leads
Then:
Now continue.
Suppose:
- 200 leads
- 60 qualified leads
Then:
And:
- 60 qualified leads
- 6 customers
Then:
This creates a much clearer picture than simply saying:
The number of leads is only useful when you understand what happens to them next.
Diagnose the Traffic → Lead Leak
If you have strong traffic but too few leads, investigate the first conversion transition.
Common causes
Wrong audience
Your marketing may attract people who are interested in the topic but have no intention of buying.
Wrong search or campaign intent
High-volume traffic can look impressive while producing little commercial value.
Weak landing page
Visitors may not immediately understand:
- what you offer
- who it is for
- why it matters
- what makes you different
- what they should do next
Weak offer
The visitor understands the service but has no compelling reason to take action now.
Too much friction
Examples include:
- long forms
- unclear buttons
- difficult navigation
- slow pages
- unnecessary fields
- confusing booking processes
Message mismatch
The advertisement, search result, social post, and landing page may communicate different things.
The visitor clicks expecting one thing and finds another.
Diagnose the Lead → Qualified Lead Leak
A high lead count can create a false sense of success.
Imagine:
That means only 5% of leads are becoming genuinely useful sales opportunities.
The problem may not be the website.
It may be:
- poor targeting
- overly broad campaigns
- weak lead magnets
- incorrect audience assumptions
- unclear qualification criteria
- low purchase intent
- irrelevant traffic
- poor campaign messaging
This is why lead volume should never be treated as the final marketing KPI.
A business should understand the difference between:
If lead quality is the problem, generating more leads may actually create more work for the sales team without improving revenue.
Diagnose the Qualified Lead → Sale Leak
Sometimes marketing is doing its job.
The business is attracting the right people.
The website is generating relevant leads.
The sales team is receiving qualified opportunities.
But sales are still low.
Now investigate what happens after the lead becomes a sales opportunity.
Look at:
- response time
- follow-up process
- number of follow-ups
- sales qualification
- pricing
- proposal quality
- objections
- sales cycle length
- product-market fit
- trust signals
- competitor positioning
For example:
is very different from:
If traffic and lead generation are healthy but sales are weak, increasing traffic is unlikely to be the first priority.
The bottleneck may sit inside the sales process or offer.
Find the First Major Funnel Leak
A useful diagnostic rule is to look for the largest meaningful drop between two stages.
Consider this funnel:
| Stage | Volume | Conversion |
|---|---|---|
| Visitors | 20,000 | — |
| Leads | 800 | 4% |
| Qualified leads | 120 | 15% |
| Sales opportunities | 80 | 67% |
| Customers | 8 | 10% |
At first glance, 800 leads looks excellent.
But only 120 are qualified.
And only 8 become customers.
That means there may be two separate problems:
- Lead quality
- Sales conversion
The correct solution is not automatically “get more traffic.”
The correct solution is to identify which leak has the greatest financial impact.
Calculate the Money Lost at Each Stage
Conversion rates tell you where the funnel is weak.
Revenue data tells you where the weakness matters most.
Suppose your average customer value is ₹40,000.
If improving one stage could create 10 additional customers, the potential revenue impact is:
Now compare that with another optimization that might create only two additional customers.
Even if both improvements are technically possible, the first deserves greater attention.
You can create a simple prioritization model:
| Funnel Problem | Potential Improvement | Expected Customer Impact | Priority |
|---|---|---|---|
| Low traffic | +20% traffic | +3 customers | Medium |
| Low visitor-to-lead rate | 2% → 3% | +10 customers | High |
| Poor lead quality | 20% → 30% qualified | +6 customers | High |
| Low sales conversion | 5% → 8% | +8 customers | High |
This changes the conversation from:
to:
Use the Funnel Leak Diagnosis Framework
Use this five-step process.
Measure
Collect:
- traffic
- leads
- qualified leads
- sales opportunities
- customers
- revenue
- marketing spend
Calculate
Calculate conversion rates between every stage.
For example:
Segment
Do not look only at blended numbers.
Break the funnel down by:
- channel
- campaign
- landing page
- audience
- location
- device
- product/service
- new vs returning visitor
A 3% overall conversion rate can hide major differences.
For example:
| Source | Traffic | Leads | Lead Rate |
|---|---|---|---|
| Organic | 5,000 | 150 | 3% |
| Google Ads | 3,000 | 120 | 4% |
| Social | 4,000 | 40 | 1% |
The overall average may look acceptable.
But social traffic may require a completely different strategy.
Identify
Find the stage where the largest commercially important leakage occurs.
Prioritize
Fix the problem with the strongest combination of:
Build a Simple Funnel Leak Score
You can make prioritization more objective.
Score each problem from 1–5.
| Factor | Question |
|---|---|
| Volume | How many users are affected? |
| Conversion gap | How far below target is the stage? |
| Revenue impact | How much money could improvement generate? |
| Confidence | How confident are you about the cause? |
| Speed | How quickly can you test a fix? |
Then calculate:
For example:
| Problem | Volume | Gap | Revenue | Confidence | Speed | Score |
|---|---|---|---|---|---|---|
| Weak landing page | 5 | 5 | 5 | 4 | 4 | 23 |
| Low organic traffic | 4 | 3 | 4 | 3 | 2 | 16 |
| Poor lead quality | 4 | 5 | 5 | 4 | 3 | 21 |
| Slow sales follow-up | 3 | 4 | 5 | 5 | 4 | 21 |
The exact scoring model can vary.
The important thing is creating a repeatable way to decide what gets fixed first.
Check Whether Your Website Is Part of the Problem
Sometimes the funnel leak appears to be a marketing problem but is actually a website problem.
Look at:
- landing-page relevance
- page speed
- mobile experience
- navigation
- forms
- calls to action
- trust signals
- service pages
- booking flow
- technical errors
- analytics tracking
For service businesses, the website should make it easy for a visitor to understand the service, establish trust, and take the next step.
A useful next resource is our guide to [conversion-focused web development for businesses](https://www.sampurndigital.com/blog/web-development/lead-generation-website-architecture-for-service-businesses).
Check Paid Traffic Separately
Paid traffic can produce a particularly visible funnel leak because money is spent before the conversion happens.
Look at:
If clicks are expensive but leads are low, investigate:
- targeting
- keywords
- search terms
- ad messaging
- creative
- landing-page relevance
- conversion tracking
If leads are strong but customer acquisition cost is increasing, the problem may occur further down the funnel.
Our guide on [performance marketing and paid acquisition](https://www.sampurndigital.com/blog/performance-marketing/why-your-cost-per-lead-is-increasing-a-diagnostic-framework) goes deeper into diagnosing rising acquisition costs.
Compare Funnel Performance by Channel
Do not assume every marketing channel should produce the same result.
SEO, paid search, social media, email, referrals, and direct traffic can have different:
- intent levels
- conversion rates
- customer values
- acquisition costs
- sales cycles
For example:
| Channel | Visitors | Leads | Customers | Revenue |
|---|---|---|---|---|
| SEO | 10,000 | 300 | 18 | ₹9L |
| Paid Search | 5,000 | 250 | 15 | ₹7.5L |
| Social | 8,000 | 120 | 4 | ₹2L |
| Referral | 1,000 | 100 | 12 | ₹6L |
Traffic alone would make social look important.
Revenue and customer conversion tell a different story.
This is why channel selection should be based on business outcomes, not simply visibility. You can also review [which marketing channel your business should invest in first](https://www.sampurndigital.com/blog/digital-marketing/which-marketing-channel-should-your-business-invest-in-first).
Understand the Customer Journey Across Channels
Customers rarely follow a perfectly linear path.
A customer might:
If you analyze only the final click, you may misunderstand what influenced the purchase.
This is why your funnel should include the broader customer journey, not just one campaign.
For a deeper view, read [our guide to how customers move from search to social media to your website](https://www.sampurndigital.com/blog/digital-marketing/how-customers-move-from-search-to-social-media-to-your-website).
Build a Funnel Diagnosis Table
Use this template every month.
| Stage | Metric | Current | Target | Gap | Likely Cause | Action |
|---|---|---|---|---|---|---|
| Traffic | Visitors | 20,000 | 25,000 | \-5,000 | Low demand | Traffic strategy |
| Traffic → Lead | Lead rate | 1.5% | 3% | \-1.5% | Weak offer | Landing-page test |
| Lead → Qualified | Qualification | 20% | 35% | \-15% | Poor targeting | Audience refinement |
| Qualified → Sale | Close rate | 8% | 12% | \-4% | Sales process | Follow-up improvement |
| Sale | Revenue | ₹6L | ₹10L | \-₹4L | Multiple leaks | Prioritize highest-impact stage |
This table turns a vague marketing problem into a structured diagnosis.
Don't Fix Everything at Once
One of the biggest mistakes businesses make is trying to optimize the entire funnel simultaneously.
They may:
- redesign the website
- launch new ads
- publish more blogs
- change social strategy
- create new offers
- change CRM
- change pricing
all at the same time.
The problem?
You may never know what actually improved performance.
Instead:
Find the biggest leak
Identify the first major commercially important bottleneck.
Identify the likely cause
Use analytics, user behavior, campaign data, sales feedback, and customer conversations.
Make one meaningful change
Change the variable most likely responsible.
Measure the result
Compare performance against the previous baseline.
Move to the next leak
Once the first bottleneck improves, reassess the entire funnel.
This creates an iterative growth system instead of random optimization.
Funnel Leak Audit Checklist
Use this checklist before increasing your marketing budget.
Traffic
- Are we attracting the right audience?
- Is traffic coming from relevant intent?
- Are the main acquisition channels clearly identified?
- Are traffic trends stable or declining?
- Are channel-level results being measured?
Traffic → Lead
- Is the landing page relevant to the traffic source?
- Is the offer clear?
- Is the CTA obvious?
- Is the form unnecessarily complicated?
- Does the page work well on mobile?
- Are visitors seeing enough trust signals?
Lead Quality
- Are leads relevant to the business?
- Are campaigns targeting the correct audience?
- Are lead sources being tracked?
- Are low-quality sources identified?
- Are qualification criteria clearly defined?
Lead → Sale
- Are leads contacted quickly?
- Is follow-up consistent?
- Are sales objections recorded?
- Is pricing creating friction?
- Are qualified opportunities clearly tracked?
- Is the sales cycle understood?
Revenue
- Is revenue tracked by channel?
- Is customer acquisition cost understood?
- Is customer value understood?
- Are profitable channels separated from high-volume channels?
- Are marketing decisions based on revenue rather than traffic alone?
Final Diagnosis: Find the Leak Before You Add More Traffic
A marketing funnel is not simply a traffic-generation system.
It is a sequence:
Every transition can lose value.
The goal is not necessarily to maximize every number.
The goal is to identify where the funnel is losing the most commercially valuable opportunities and fix that stage first.
If traffic is low, improve acquisition.
If traffic is strong but leads are weak, investigate conversion.
If leads are strong but quality is poor, improve targeting and qualification.
If qualified leads are strong but sales are weak, investigate the offer and sales process.
And if all of those numbers look healthy but profitability is weak, investigate acquisition cost, customer value, margins, and attribution.
That is how a business moves from:
to:
For businesses that need help diagnosing and improving the complete journey, [Sampurn Digital’s Digital Marketing services](https://www.sampurndigital.com/digital-marketing-services) can help connect acquisition, conversion, measurement, and growth into one system.