
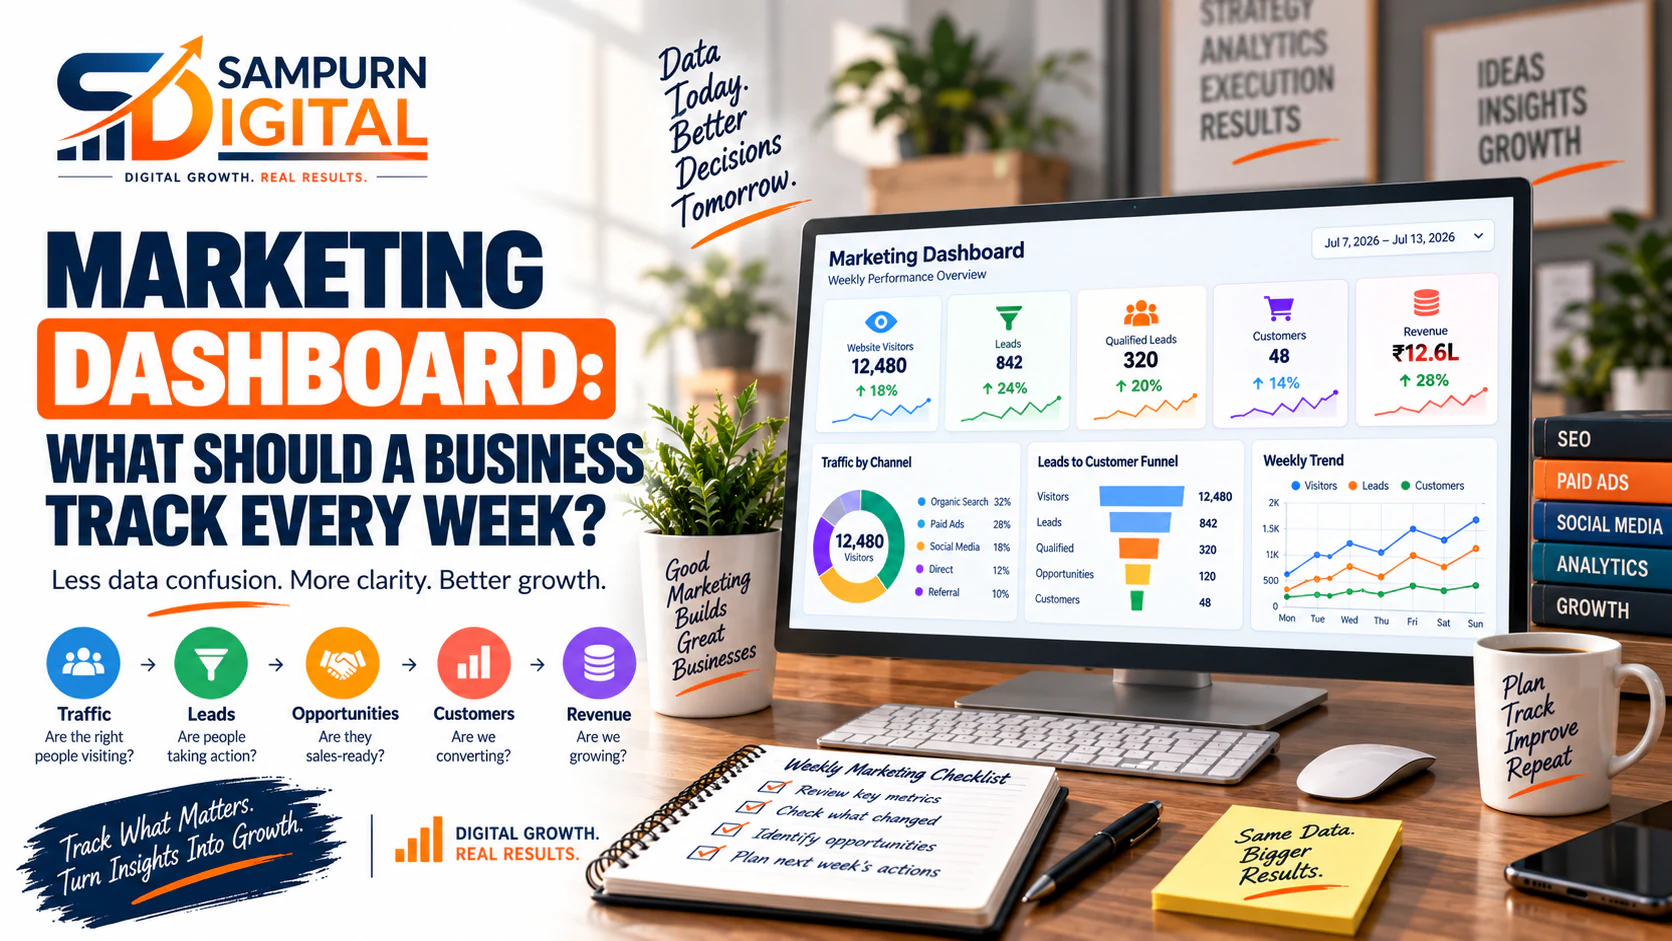
Most businesses have access to more marketing data than they can realistically use.
You can open:
- Google Analytics
- Google Ads
- Meta Ads
- Search Console
- Social media analytics
- CRM reports
- Email platforms
- Website dashboards
and find hundreds of numbers.
But when the weekly marketing meeting starts, someone eventually asks:
“So… how is our marketing actually performing?”
And the team starts discussing impressions, clicks, followers, traffic and leads without reaching a clear conclusion.
The problem usually isn't a lack of data.
It is a lack of focus.
A useful marketing dashboard should help a business understand:
This guide explains what a business should track every week and how to build a dashboard that supports actual decisions instead of becoming another collection of vanity metrics.
First: Don't Track Everything Just Because You Can
A dashboard is not supposed to contain every available metric.
If your team tracks 100 numbers every week, it becomes difficult to identify what actually changed.
Instead, start with the business journey:
Your dashboard should help explain where performance is strong and where the journey is breaking.
That is far more useful than simply reporting:
“Website traffic increased 23% this week.”
Start With the Business Goal
Before choosing metrics, define the business objective.
It could be:
- Generate more qualified leads
- Increase ecommerce revenue
- Reduce customer acquisition cost
- Improve conversion rate
- Increase sales opportunities
- Improve marketing efficiency
- Scale a profitable channel
Your dashboard should reflect that objective.
For example:
Lead Generation Business
Primary metrics:
- Qualified leads
- Opportunities
- Customer acquisition cost
- Revenue
Ecommerce Business
Primary metrics:
- Revenue
- Transactions
- Conversion rate
- Average order value
- Customer acquisition cost
Local Business
Primary metrics:
- Enquiries
- Calls
- Booking requests
- Qualified leads
- Customers
The dashboard should follow the business model.
Track a Small Set of Executive Metrics
A business owner usually does not need 40 marketing metrics every Monday morning.
Start with a small executive scorecard.
For example:
| Metric | This Week | Previous Week | Change |
|---|---|---|---|
| Website Sessions | 12,400 | 11,100 | +11.7% |
| Leads | 180 | 165 | +9.1% |
| Qualified Leads | 72 | 61 | +18.0% |
| Opportunities | 31 | 28 | +10.7% |
| Customers | 12 | 10 | +20.0% |
| Marketing Spend | ₹1,20,000 | ₹1,15,000 | +4.3% |
| Revenue | ₹6,50,000 | ₹5,40,000 | +20.4% |
This immediately gives leadership a high-level picture.
The detailed channel data can sit underneath it.
Separate Leading and Lagging Metrics
Not every metric tells you the same thing.
Leading Metrics
These indicate activity or potential future performance.
Examples:
- Website traffic
- Content engagement
- Ad clicks
- Landing page visits
- Leads
- Email engagement
Lagging Metrics
These represent actual business outcomes.
Examples:
- Qualified opportunities
- Customers
- Revenue
- Customer acquisition cost
- Profit
Both matter.
But do not confuse activity with results.
More traffic is not necessarily better if it does not produce more valuable customers.
This is why understanding [how to improve your digital marketing is getting traffic but not enough customers](https://chatgpt.com/blog/digital-marketing/why-your-digital-marketing-is-getting-traffic-but-not-enough-customers) is important when interpreting dashboard changes.
Track Website Traffic — But Give It Context
Website traffic is useful.
But traffic alone does not tell you whether marketing is working.
Track:
- Total sessions
- Users
- New users
- Traffic sources
- Landing pages
- Geographic performance where relevant
- Device performance
- Returning visitors
Then connect traffic to outcomes.
For example:
sounds positive.
But if:
there may be a conversion problem.
Likewise:
with:
may indicate much stronger traffic quality.
The number matters.
The relationship between numbers matters more.
Track Leads
Leads are an important middle-of-funnel metric for service businesses.
Track:
- Total leads
- Leads by channel
- Leads by campaign
- Lead conversion rate
- Cost per lead
But don't stop there.
A lead is not automatically a sales opportunity.
A marketing dashboard should eventually distinguish:
This prevents marketing teams from optimizing for low-quality lead volume.
Track Lead Quality
Suppose your marketing generates:
That sounds good.
But then the sales team reports:
- 80 irrelevant
- 60 outside target geography
- 40 poor fit
- 30 duplicate or spam
- 20 not ready
- 20 qualified
Now the actual situation is very different.
Track:
- Qualified lead rate
- Qualification rate by channel
- Opportunity rate
- Lead-to-customer rate
This gives marketing a better understanding of lead quality.
Track Conversion Rates Between Funnel Stages
A useful dashboard should show the movement between stages.
For example:
Now you can calculate:
- Visitor → Lead
- Lead → Qualified Lead
- Qualified Lead → Opportunity
- Opportunity → Customer
If one stage suddenly falls, you have a starting point for diagnosis.
For the complete journey, see [a practical digital growth funnel guide](https://chatgpt.com/blog/digital-marketing/the-complete-digital-growth-funnel-from-first-click-to-customer).
Track Marketing Spend
Your dashboard should show how much money is being invested.
Track:
- Total marketing spend
- Paid advertising spend
- Spend by channel
- Spend by campaign
- Month-to-date spend
- Budget utilization
This provides context for performance.
For example:
does not mean much if:
A good dashboard compares outcomes with investment.
Track Cost Per Lead
Cost per lead is calculated as:
For example:
₹1,00,000 spend ÷ 100 leads
\= ₹1,000 CPL
This is useful.
But remember:
A channel generating inexpensive but poor-quality leads may be less valuable than a channel generating expensive but high-quality opportunities.
Track Customer Acquisition Cost
Customer acquisition cost goes further.
A simplified formula is:
For example:
₹3,00,000 acquisition cost ÷ 20 customers
\= ₹15,000 CAC
This is often more meaningful than CPL because customers are the actual business outcome.
Your dashboard should therefore move progressively toward customer-level measurement.
Track Revenue From Marketing
Revenue is one of the most important metrics.
Track:
- Total revenue
- Revenue by channel
- Revenue by campaign where reliable
- Revenue from new customers
- Revenue from returning customers
- Revenue per customer
This helps connect marketing activity to business value.
A dashboard that stops at clicks and leads is incomplete for businesses that can connect marketing to sales.
Track SEO Performance Separately
SEO has its own useful metrics.
Track:
- Organic sessions
- Organic conversions
- Important landing pages
- Search visibility
- Search impressions
- Clicks
- Click-through rate
- Ranking trends for important terms
Do not treat rankings as the final goal.
The important question is:
Is organic search bringing the right visitors and contributing to business outcomes?
For a dedicated SEO reporting framework, see [SEO strategy and organic search for businesses](https://chatgpt.com/blog/seo/seo-reporting-for-business-owners-what-numbers-actually-matter).
Track Paid Advertising Separately
Paid campaigns require their own operating metrics.
Track:
- Spend
- Impressions
- Clicks
- CTR
- CPC
- Conversions
- Conversion rate
- Cost per conversion
- Qualified leads
- Revenue
- ROAS where applicable
The exact metrics depend on the platform and business model.
For deeper paid-performance measurement, use [performance marketing and paid acquisition guide](https://chatgpt.com/blog/performance-marketing/weekly-paid-ads-performance-dashboard-what-should-you-track).
Track Social Media Beyond Followers
Follower growth can be useful.
But it should not dominate your dashboard.
Track:
- Reach
- Engagement
- Video views
- Profile visits
- Website clicks
- Leads
- Qualified leads
- Revenue where measurable
For a deeper look at social measurement, see [how social media growth strategy works](https://chatgpt.com/blog/social-media-marketing/social-media-roi-dashboard-the-metrics-that-matter).
The key question is:
What business outcome is social media contributing to?
Track Landing Page Performance
If you send paid, organic or social traffic to landing pages, measure what happens there.
Track:
- Landing page visits
- Conversion rate
- Form submissions
- Calls
- Bookings
- Bounce or engagement indicators where useful
- Device-level performance
If traffic is strong but conversions are weak, the issue may be the landing page rather than the acquisition channel.
This prevents teams from blaming advertising for a website conversion problem.
Track Website Conversion Rate
A simple conversion rate is:
For example:
500 conversions ÷ 10,000 visitors
\= 5% conversion rate
But be careful about what counts as a conversion.
A newsletter signup, a contact form, a purchase and a phone call are different outcomes.
Define conversion events clearly.
Track Channel Contribution
Your dashboard should allow you to compare:
| Channel | Traffic | Leads | Qualified Leads | Customers | Revenue |
|---|---|---|---|---|---|
| SEO | 8,000 | 120 | 50 | 12 | ₹6L |
| Paid | 5,000 | 150 | 45 | 8 | ₹4L |
| Social | 4,000 | 70 | 20 | 3 | ₹1L |
| Referral | 800 | 30 | 18 | 7 | ₹3L |
This gives a much better picture than simply ranking channels by traffic.
For more accurate cross-channel measurement, see [how to improve marketing attribution](https://chatgpt.com/blog/digital-marketing/marketing-attribution-how-to-know-which-channel-generated-the-customer).
Track Week-over-Week Change
A dashboard should not just show today's number.
Show movement.
For example:
Last week: 150
This week: 180
Change: +20%
Then ask:
Why?
Maybe:
- Paid spend increased
- SEO traffic improved
- A new campaign launched
- A landing page was changed
- Seasonality affected demand
The change is the signal.
The diagnosis is the action.
Use Month-to-Date Data for Context
Weekly data can be noisy.
One week may be unusually strong or weak.
Therefore, compare:
- This week
- Previous week
- Month-to-date
- Previous month
- Same period where seasonality matters
This helps prevent overreacting to temporary fluctuations.
Track Marketing Budget vs Actual Spend
For businesses with defined budgets, include:
| Category | Monthly Budget | Actual | Remaining |
|---|---|---|---|
| SEO | ₹75,000 | ₹50,000 | ₹25,000 |
| Paid Ads | ₹1,50,000 | ₹1,20,000 | ₹30,000 |
| Social | ₹50,000 | ₹35,000 | ₹15,000 |
| Content | ₹25,000 | ₹20,000 | ₹5,000 |
This helps management see whether spending is aligned with the plan.
A budget dashboard becomes especially useful when multiple channels compete for resources.
Add a "What Changed?" Section
This is one of the most useful additions to a weekly dashboard.
Do not only show numbers.
Add a short explanation.
Example
Why?
Two high-value articles gained visibility.
Why?
One campaign's cost per conversion increased.
Why?
Lead-generation targeting was narrowed.
This transforms a dashboard from a reporting document into a decision-making tool.
Add an "Action Required" Section
Every weekly review should identify actions.
For example:
Action 1
Investigate paid campaign with rising acquisition cost.
Action 2
Improve landing page with declining conversion rate.
Action 3
Expand SEO content around a topic generating qualified leads.
Action 4
Reduce spend on a campaign generating low-quality leads.
Action 5
Test a new social creative based on recent engagement patterns.
The dashboard should lead to action.
Build the Dashboard Around Questions
Instead of organizing the dashboard around platforms, organize it around business questions.
Question 1
Are we generating enough demand?
Track:
- Traffic
- Impressions
- Reach
- Search visibility
Question 2
Are visitors becoming leads?
Track:
- Conversion rate
- Leads
- Cost per lead
Question 3
Are leads valuable?
Track:
- Qualified leads
- Qualification rate
- Opportunities
Question 4
Are we generating customers?
Track:
- Customers
- Customer acquisition cost
- Customer conversion rate
Question 5
Is marketing producing revenue?
Track:
- Revenue
- ROAS where relevant
- ROI where measurable
- Revenue by channel
This creates a much more useful dashboard structure.
Use a Weekly Marketing Dashboard Structure
A practical weekly dashboard can have five sections.
Section 1: Executive Summary
- Leads
- Qualified leads
- Customers
- Revenue
- Marketing spend
- CAC
Section 2: Channel Performance
- SEO
- Paid
- Social
- Referral
Section 3: Funnel Performance
- Traffic
- Leads
- Qualified leads
- Opportunities
- Customers
Section 4: Problems and Opportunities
- Biggest decline
- Biggest improvement
- Emerging opportunity
- Tracking issue
Section 5: Actions
- What to fix
- What to test
- What to scale
- Who owns the action
This keeps the dashboard focused.
Don't Turn the Dashboard Into a Data Dump
Avoid adding metrics simply because they are available.
For example:
- Total followers
- Total impressions
- Total clicks
- Total sessions
- Total page views
- Total likes
These can be useful.
But if they don't help explain business performance, they should not dominate the dashboard.
Ask:
“What decision will this metric help us make?”
If there is no good answer, consider removing it.
Create a Simple Weekly Scorecard
A simple scorecard might look like this:
| Area | Metric | Status | Weekly Insight |
|---|---|---|---|
| Acquisition | Qualified Leads | Strong | Increased 15% |
| SEO | Organic Leads | Improving | Two pages gained visibility |
| Paid | CAC | Watch | Increased 12% |
| Social | Website Leads | Stable | Engagement improved |
| Website | Conversion Rate | Weak | Mobile conversion declined |
| Revenue | New Customer Revenue | Strong | Increased 18% |
This lets leadership understand performance quickly.
Connect Dashboard Data to Attribution
If multiple channels contribute to the customer journey, don't assume the final channel deserves all the credit.
Your dashboard should ideally show both:
- Channel performance
- Customer outcomes
This is where attribution becomes important.
A dashboard can tell you:
“Paid generated 40 leads.”
Attribution and CRM data can help answer:
“How many of those became customers?”
That distinction matters.
Make the Dashboard Actionable for Different Teams
Different people need different views.
Business Owner
Needs:
- Revenue
- Customers
- CAC
- Marketing investment
- Overall growth
Marketing Manager
Needs:
- Channel performance
- Leads
- Qualified leads
- Conversion rates
- Budget
SEO Team
Needs:
- Organic traffic
- Search visibility
- Important pages
- Organic conversions
Paid Team
Needs:
- Spend
- CPC
- Conversion rate
- CPA
- ROAS
- Campaign performance
Social Team
Needs:
- Reach
- Engagement
- Clicks
- Leads
- Content performance
The executive dashboard can stay simple while team-level dashboards contain more detail.
Set Thresholds for Important Metrics
Not every change requires immediate action.
Define thresholds.
For example:
CAC
- Normal: within target
- Watch: +10%
- Action: +20%
Conversion Rate
- Normal: above target
- Watch: 10% decline
- Action: 20% decline
Qualified Lead Rate
- Normal: above 30%
- Watch: 25–30%
- Action: below 25%
The exact thresholds should come from your business economics.
The purpose is to prevent emotional decision-making.
Review the Dashboard at the Same Time Every Week
Consistency matters.
Choose one weekly review process.
For example:
Step 1
Update data.
Step 2
Check tracking.
Step 3
Compare performance.
Step 4
Identify major changes.
Step 5
Diagnose causes.
Step 6
Assign actions.
Step 7
Review previous actions.
This creates a repeatable marketing operating rhythm.
Use the Dashboard to Find Problems Early
A good dashboard acts like an early-warning system.
For example:
Potential website or offer problem.
Potential traffic-quality or targeting problem.
Potential sales qualification or closing problem.
The dashboard helps identify where to investigate.
Don't Fix Every Metric at the Same Time
If five metrics decline, don't immediately launch five separate projects.
Prioritize.
Ask:
- Which decline affects revenue most?
- Is the change statistically or commercially meaningful?
- Is it a tracking issue?
- Is it temporary?
- Can we identify a likely cause?
- What action has the highest potential impact?
Fix the highest-impact problem first.
Use a Dashboard to Support Monthly Strategy
Weekly dashboards are for operating decisions.
Monthly reviews are better for larger strategic questions.
For example:
- Should we increase SEO investment?
- Should paid budget move between platforms?
- Should we change our offer?
- Should we invest more in content?
- Is our website conversion rate limiting growth?
- Should we enter a new channel?
The weekly dashboard provides the evidence.
The monthly review turns that evidence into strategy.
A Practical Weekly Dashboard Template
Use this structure:
Executive Metrics
- Revenue
- Customers
- Qualified leads
- Opportunities
- CAC
- Marketing spend
Acquisition
- Organic traffic
- Paid traffic
- Social traffic
- Referral traffic
Conversion
- Leads
- Lead conversion rate
- Qualified lead rate
- Opportunity rate
- Customer conversion rate
Channel Performance
- SEO
- Paid
- Social
- Referral
Efficiency
- CPL
- CAC
- ROAS
- ROI where measurable
Website
- Conversion rate
- Top landing pages
- Conversion issues
Insights
- Biggest improvement
- Biggest decline
- Key opportunity
- Key risk
Actions
- Fix
- Test
- Scale
- Owner
Marketing Dashboard Checklist
Before using your dashboard, confirm:
- Business goals are clearly defined
- Primary KPIs are identified
- Leading and lagging metrics are separated
- Website traffic is tracked
- Leads are tracked
- Qualified leads are tracked
- Opportunities are tracked
- Customers are tracked
- Revenue is tracked
- Marketing spend is tracked
- CPL is calculated
- CAC is calculated
- SEO performance is visible
- Paid performance is visible
- Social performance is visible
- Website conversion rate is visible
- Channel performance can be compared
- Week-over-week changes are visible
- Month-to-date performance is visible
- Budget vs actual spend is visible
- Major changes have explanations
- Action items are recorded
- Owners are assigned
- Attribution limitations are understood
- Vanity metrics do not dominate the dashboard
Final Diagnosis: A Dashboard Should Help You Decide What to Do Next
A marketing dashboard is not successful because it contains hundreds of metrics.
It is successful when a business can open it and quickly answer:
Are we growing?
Which channels are contributing?
Are our leads good enough?
Where are we losing potential customers?
Are we spending efficiently?
What changed this week?
What should we do next?
The most useful structure is:
Then layer channel performance underneath it:
The dashboard should connect activity to outcomes.
That is the difference between a marketing reporting dashboard and a marketing decision system.
If traffic rises but customers don't, investigate the funnel.
If leads rise but quality falls, investigate targeting.
If customers rise while spend remains stable, identify what is working and consider scaling it.
If revenue rises but acquisition cost rises even faster, investigate efficiency.
The numbers are not the strategy.